
GBP/USD 15M
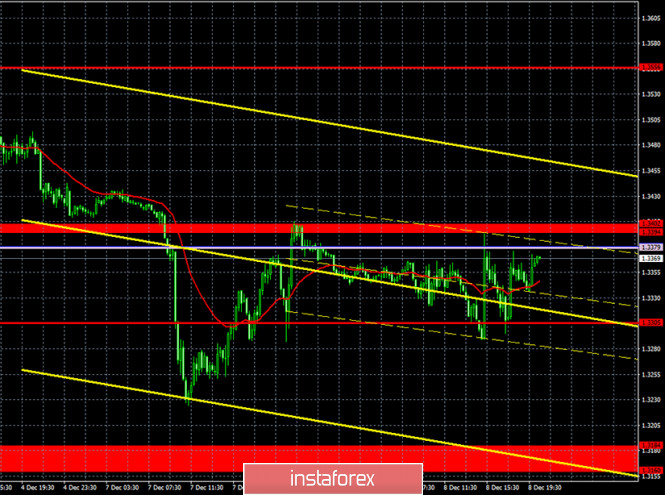
Both linear regression channels are directed to the downside on the 15-minute timeframe, which is fully consistent with what is happening on the hourly timeframe. Unfortunately, the erratic movement also persists, so a new round of upward and downward movement may occur at any moment. So far, the pair is stuck between the Senkou Span B line and 1.3305. Therefore, the price can move in the direction of whichever one of these lines is overcome.
GBP/USD 1H
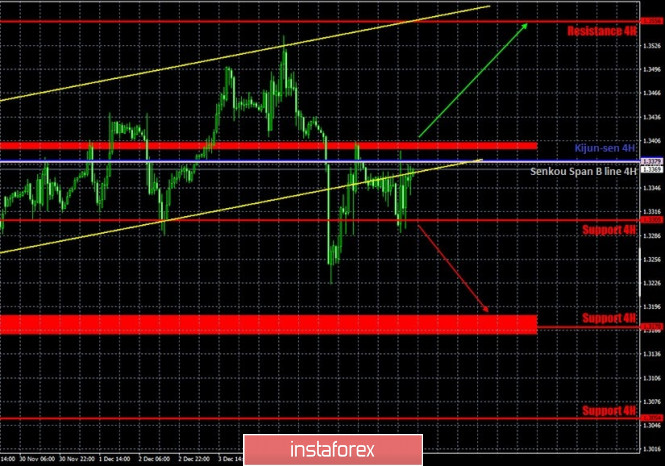
The GBP/USD pair could not determine the direction of its movement on Tuesday. After the pair fell by 300 points and also quickly recovered by 180, the markets calmed down a bit. However, at the same time, the pair is still moving in an erratic manner. There is no trend, so it is extremely difficult to work with the pair now. The quotes left the rising channel, in which they had been for a long time. However, this consolidation is not a strong signal in the current environment. For example, yesterday the quotes failed to break through either the support level of 1.3305, or through the Senkou Span B and Kijun-sen lines. Thus, the situation is now confusing and ambiguous not only on the 4-hour timeframe, but also on the hourly one. We continue to expect a new downward trend, but the markets remain in an agitated state and clearly cannot determine the direction of trading.
COT report
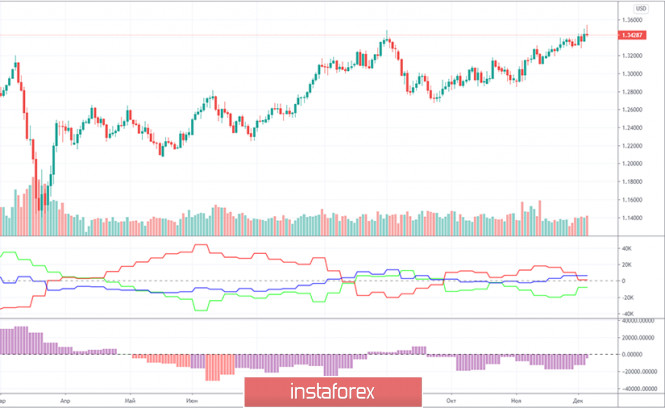
The GBP/USD pair did not grow and did not fall by a single point during the last reporting week (November 24-30). There were no price changes during this period. But in general, there was still an upward trend that extended into the following week. If in the case of the euro/dollar pair, we had been waiting for the beginning of a new downward trend, in the pound/dollar pair's case, the Commitment of Traders (COT) reports did not allow such conclusions to be drawn. You only need to look at both indicators in the chart to understand that there is no trend in the mood of major players. The first indicator constantly shows a shift in the mood of commercial and non-commercial traders from bearish to bullish and vice versa. The second indicator constantly shows that the net position of the "non-commercial" group is growing and decreasing. That is, we can not draw conclusions regarding the pair's future from the COT reports. Non-commercial traders opened 3,600 new Buy-contracts (longs) and closed 4,400 Sell-contracts (shorts) during the reporting week. The net position immediately increased by 8,000, which is a lot for the pound. But there were no price changes. The number of open Buy and Sell contracts for the non-commercial group is practically the same.
The fundamentals for the British currency on Tuesday were no different from Monday. Negotiations on the trade deal are still extremely important for the pound. However, we have not received any positive news on this. Rather, negotiators and senior EU and UK officials are increasingly acknowledging that negotiations are at an impasse. Following statements that the negotiating groups continue to work intensively in order to reach an agreement "in the near future." But we have been hearing such statements continuously over the past couple of months. And nothing changes. And there are no statements of progress. All media and leaders of the EU and Britain continue to declare that "time is running out" and everything must be decided "in the next few days." But in this regard, nothing changes either, and the negotiations just continue...
No major events scheduled for Wednesday in the UK and US. Therefore, traders can and should turn their attention to technique and possible news from the negotiation process between London and Brussels. We can't identify any more important factors for the pair at the moment. However, even the technical picture isn't exactly the most unambiguous.
We have two trading ideas for December 9:
1) Buyers for the pound/dollar pair have released the initiative from their hands. Now they need to return the pair above the resistance area of 1.3394-1.3402, and only after that should you reopen long positions while aiming for the resistance level of 1.3556, which is very far away. Take Profit in this case will be up to 130 points. At the same time, the pair is still moving erratically, which has been going on for several weeks, if not more.
2) Sellers seem to have made a tangible step towards the new downward trend, but now they need to overcome the 1.3305 support level in order to expect something more. We recommend selling the pound/dollar pair while aiming for the support area of 1.3160 -1.3184, if quotes settle below 1.3305. Take Profit in this case can be up to 100 points. You can also open shorts for the rebound from Senkou Span B (1.3379) and Kijun-sen (1.3380) lines.
Forecast and trading signals for EUR/USD
Explanations for illustrations:
Support and Resistance Levels are the levels that serve as targets when buying or selling the pair. You can place Take Profit near these levels.
Kijun-sen and Senkou Span B lines are lines of the Ichimoku indicator transferred to the hourly timeframe from the 4-hour one.
Support and resistance areas are areas from which the price has repeatedly rebounded off.
Yellow lines are trend lines, trend channels and any other technical patterns.
Indicator 1 on the COT charts is the size of the net position of each category of traders.
Indicator 2 on the COT charts is the size of the net position for the "non-commercial" group.
The material has been provided by InstaForex Company - www.instaforex.com