
EUR/USD 15M
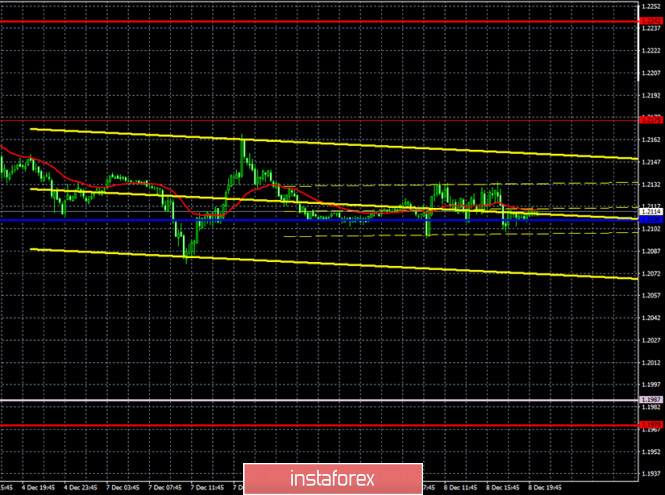
Both linear regression channels turned to the downside on the 15-minute timeframe, so the pair has a good chance of continuing the downward correction. We expect the quotes to continue falling, but the slope angles of both channels are extremely small, so the correction is very weak.
EUR/USD 1H
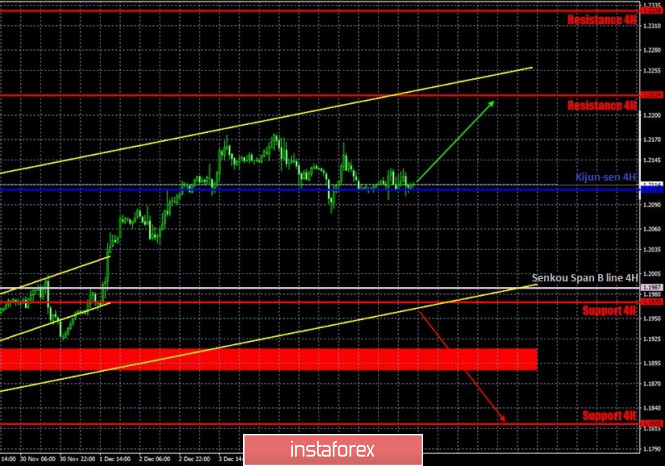
The EUR/USD pair tried to continue the correctional movement on the hourly timeframe on Tuesday, December 8, but it did not come out very convincingly. The critical Kijun-sen line rose to the price, and not vice versa. Therefore, we can conclude that the upward trend persists, and the correction is extremely weak. The upward channel also clearly shows the current sentiment of market participants. Thus, the corrective movement will likely continue, but now going beyond the Kijun-sen line will no longer be considered a strong sell signal. First of all, the pair's quotes are still within the rising channel. Secondly, the Kijun-sen line has lost its strength. Volatility for the pair has been generally quite low recently. The technical picture is even a bit like a flat. No rebound from the Kijun-sen line, nor was it overcome over the past day, so traders should not have opened any positions based on our recommendations.
COT report
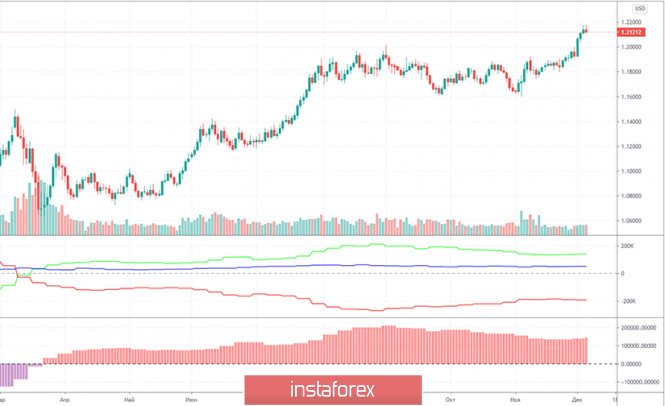
The EUR/USD pair grew by only 80 points during the last reporting week (November 24-30). But the new Commitment of Traders (COT) report indicates that professional traders are becoming more bullish for the second consecutive week. This time, the "non-commercial" group opened 4,300 new Buy-contracts (longs) and closed 300 sell-contracts (shorts). These numbers are not great. Even the general changes in favor of the bulls over the past two weeks cannot be called "breaking the bearish trend". However, the net position of non-commercial traders has been growing for two consecutive weeks. And, apparently, it began to grow synchronously with the resumption of the euro/dollar pair's growth. Unfortunately, COT reports come out three days late. Thus, they can be used to determine the trend, but, as is the case with fundamental analysis, technical confirmation is always required for any conclusions drawn from the COT reports. What do we end up with? The number of open Buy-contracts for professional traders remains high at 212,000, and the number of Sell-contracts is three times less than 67,000. The gap between the two began to narrow around September (the second indicator showing the net position of the non-commercial group), but it is currently growing again. Therefore, we still expect the upward trend to end, because this is what the data of the COT report is implying (especially the first indicator). But we need technical confirmation of this.
No macroeconomic report from the US on Tuesday. Meanwhile, the European Union released a report on GDP for the third quarter, which was revised downward and reached 12.5% q/q. However, traders do not really need any statistics right now. No reaction to this report. They trade for their own reasons now and it is best to analyze technical patterns on the 1-hour and 4-hour timeframes in order to be aware of everything that is happening. The European Central Bank will hold a meeting this week, and we also have the EU summit. These two events can have a significant impact on the euro's position. The ECB might decide to expand the quantitative incentive program and/or the PEPP program. Both options imply an increase in asset repurchases from the market and filling the economy with cash. This may cause the euro to fall against the US dollar. And at the EU summit, issues of the budget for 2021-2027, the recovery fund, as well as the veto of Poland and Hungary will be resolved.
No important reports or events scheduled for the US and the EU on Wednesday. Thus, market participants will continue to wait for the ECB meeting, the EU summit, and nothing more. From our point of view, the easing of the ECB's monetary policy could push the euro to fall. However, the demand for this currency is now so high that it is far from a fact that bulls will retreat from the market because of this one event.
We have two trading ideas for December 9:
1) Buyers continue to hold the pair in their hands. Therefore, you are advised to trade upward while aiming for the resistance level of 1.2224 when the correction ends. A rebound from the Senkou Span B line (1.1987), which lies near the lower line of the rising channel, can now be used as a signal for new buy positions. Take Profit in this case can be up to 200 points.
2) Bears are very weak at this time and cannot even correct, however, the current fundamental background allows them to count on a downward movement soon. However, we advise you to wait until the price confidently leaves the rising channel before opening short positions while aiming for the support level of 1.1820, since the Kijun-sen line is now weak. Take Profit in this case can be up to 120 points.
Forecast and trading signals for GBP/USD
Explanations for illustrations:
Support and Resistance Levels are the levels that serve as targets when buying or selling the pair. You can place Take Profit near these levels.
Kijun-sen and Senkou Span B lines are lines of the Ichimoku indicator transferred to the hourly timeframe from the 4-hour one.
Support and resistance areas are areas from which the price has repeatedly rebounded off.
Yellow lines are trend lines, trend channels and any other technical patterns.
Indicator 1 on the COT charts is the size of the net position of each category of traders.
Indicator 2 on the COT charts is the size of the net position for the "non-commercial" group.
The material has been provided by InstaForex Company - www.instaforex.com