
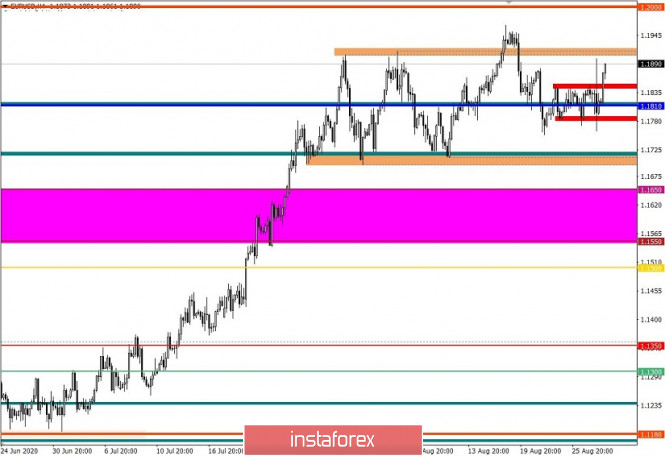
The trading week is coming to an end, and it's time for us to summarize the preliminary results. The 85-hour stagnation in the range of 1.1784/1.1850 declined under the attack of speculators, who managed to show very high activity during the past day. A local breakdown of the upper boundary of stagnation at 1.1784/1.1850 led to a fast price movement to the 1.1900 area, where the level of the main flat channel 1.1700 // 1.1810 // 1.1900 (1.1910) is located.
Price behavior and the fixing point suggests that the market remains unclear, where the flat formation, as before, will be its integral part.
The tactic of trading based on local operations has proved its efficiency once again. We will continue to stick to this method until the market gets out of the emotional background.
Considering the last trading day by the minute, we can see that the surge in long positions and the flow of short positions.
Moreover, volatility increased by 61% in daily trends relative to the average level. The growth in activity is due to the prolonged stagnation, paired with the information and news background. The activity on Thursday exceeds the dynamics of Monday - Wednesday by 120%.
As discussed in the previous review, traders have been waiting for a local surge based on the existing stagnation for a long time, positions have already been prepared, and I am sure that many have managed to capitalize on price spikes towards 1.1900.
Considering the trading chart in general terms (daily period), it can be seen that high activity during the breakdown of stagnation 1.1784/1.1850 did not change the boundaries of the main flat 1.1700 // 1.1810 // 1.1900 (1.1910).
The second estimate of the United States' GDP for the second quarter was published yesterday, where, according to the Bureau of Economic Analysis (BEA), the Department of Commerce recorded a decline in economic growth to -31.7% against the forecast of -32.9%.
A small discrepancy in the data does not cancel out the fact GDP's recorded decline.
At the same time with GDP, the volume of applications for unemployment benefits in the United States was published. So, the number of initial applications for benefits decreased by 98 thousand, while the volume of repeated applications decreased by 223 thousand.
The market's reaction at the time of the publication of data on GDP and claims for benefits did not coincide with the principles of fundamental analysis. The US dollar sharly lose momentum, before the speech of Jerome Powell.
An economic symposium started yesterday in Jackson Hole, which is held annually with the participation of representatives of central banks, finance ministers, leading economists, heads of the world's largest companies. Fed's head made a teleconference and explained the provisions of the new strategy of the regulator.
Jerome Powell said that the FOMC is targeting inflation that will average 2% over time. He believes that after a period when it has held steadily below 2%, the goal of appropriate monetary policy is likely to reach inflation directly above 2% for some time.
In fact, the market has not received a clear answer whether the regulator will discuss the interest rate until the inflation target is reached. Powell, as always, said both "yes" and "no" about rates, highlighting the point that the Fed always has tools to influence.
Market reaction
Before Powell's speech, there was an obvious speculative drift of the rate to the 1.1900 area, followed by a sharp return of the quote and stabilization.
In terms of the economic calendar, today is a quiet day, the only thing that can be noted is personal income and expenses in the United States. However, anything dramatic should not be expected, since the market is still moving away from the past day.

The upcoming trading week expects to be eventful in terms of statistics. First, we have preliminary data on Inflation in Europe, followed by the ADP US report and retail in the EU. Lastly, we have the report of the US Department of Labor.
(All time zones below are in Universal form)
Tuesday , September 1
EU 9:00 UTC+00 - Unemployment rate for July
EU 9:00 - Inflation, Preliminary
USA 14:00 - ISM Manufacturing PMI for August
Wednesday September 2nd
USA 12:15 - ADP report on employment in the private sector for August
Thursday September 3rd
EU 9:00 - Retail sales for July
USA 12:30 - Unemployment benefits claims
USA 14:00 - ISM US Non-Manufacturing Purchasing Managers Index for August
Friday September 4th
USA 12:30 - Report of the US Department of Labor
- Change in the number of people employed in the non-agricultural sector
- Unemployment rate
- Average hourly wages
Further development
Analyzing the current trading chart, you can see the price movement along a rising direction towards the border of the side channel 1.1700 // 1.1810 // 1.1900 (1.1910). We can assume that the residual background from the information flow will lead the quote to the 1.1900/1.1920 area, where there will be a stop with subsequent consolidation, which will end the trading week. In case of a repetition of the regular basis of the past, relative to the upper border of the flat, another movement in the direction of the average level of 1.1810 may appear next week.
For significant changes in the quote, it is necessary to break through the local high (1.1965) on August 18, which will lead to a further structure of the medium-term upward trend.
Indicator analysis
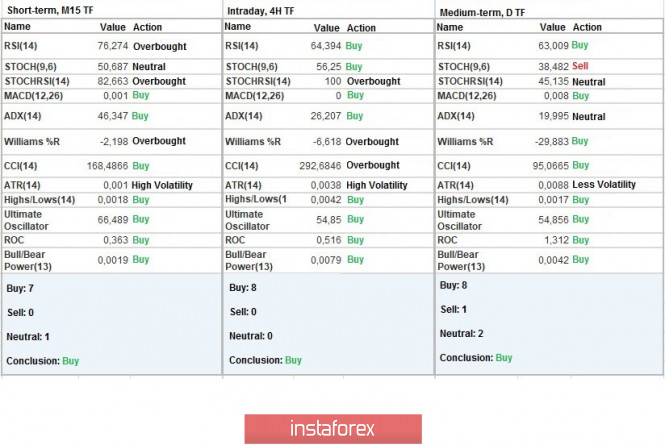
Analyzing different sectors of time frames (TF), we see that the indicators of technical instruments on minute, hourly and daily intervals signal a buy due to price movement within the upper border of the main flat.
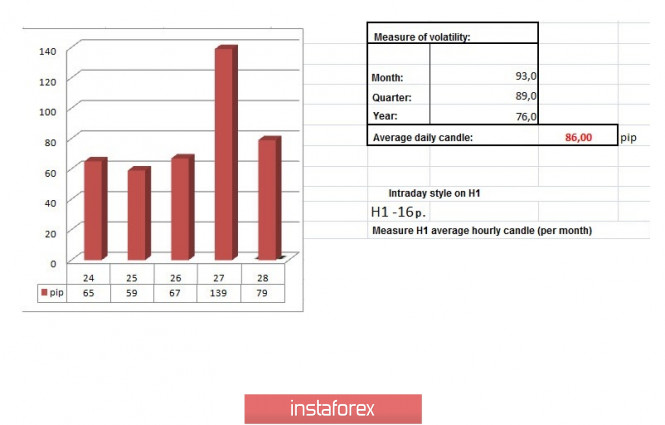
Weekly volatility / Volatility measurement: Month; Quarter; Year
The volatility measurement reflects the average daily fluctuations, calculated per Month/Quarter/Year.
(It was built considering the time of publication of the article)
The volatility of the current time is 79 points, which is considered a high value for the start of the European session. We can assume further growth in activity, but only limited to the 1.1900/1.1920 area.
Key levels
Resistance zones: 1.1910 **; 1.2000 ***; 1.2100 *; 1.2450 **; 1.2550; 1.2825.
Support zones: 1,1800; 1.1650 *; 1,1500; 1.1350; 1.1250 *; 1.1180 **; 1.1080; 1.1000 ***; 1.0850 **; 1.0775 *; 1.0650 (1.0636); 1.0500 ***; 1.0350 **; 1.0000 ***.
* Periodic level
** Range level
*** Psychological level
The material has been provided by InstaForex Company - www.instaforex.com