
Trend analysis (Fig. 1).
The market may continue to move upward from the level of 1.1865 (closing of yesterday's daily candle) with the target at the historical resistance level of 1.1912 (blue dotted line). There is a possibility that the price may continue to move upward from this level with the next target at 1.2104 - a 76.4% pullback level (blue dashed line).
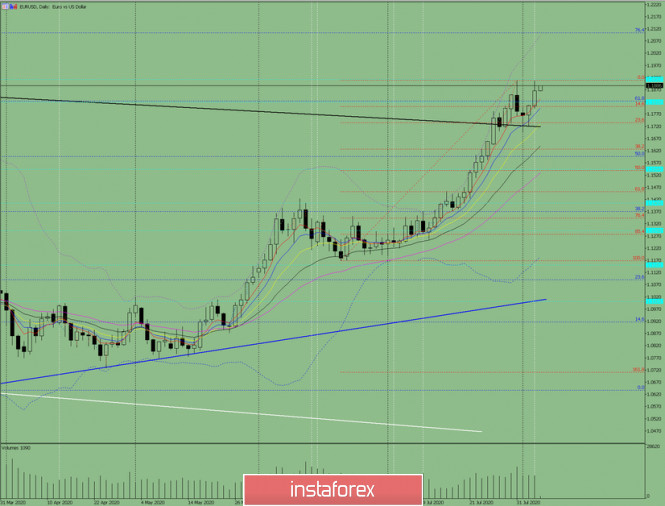
Fig. 1 (daily chart).
Comprehensive analysis:
- Indicator analysis - up;
- Fibonacci levels - up;
- Volumes - up;
- Candlestick analysis - down;
- Trend analysis - up;
- Bollinger lines - up;
- Weekly chart - up.
General conclusion:
Today, the market may continue to move upward from the level of 1.1865 (closing of yesterday's daily candle) with the target at the historical resistance level of 1.1912 (blue dotted line). There is a possibility that the price may continue to move upward from this level with the next target at 1.2104 - a 76.4% pullback level (blue dashed line).
Another possible scenario is upon testing the historical resistance level of 1.1912 (blue dashed line) the price may move downward with the target of 1.1801 - a 14.6% pullback level (red dashed line).
The material has been provided by InstaForex Company - www.instaforex.com