
EUR/USD 1H
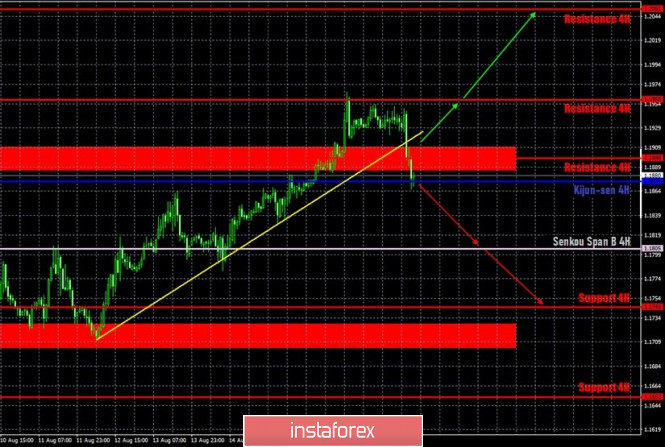
The euro/dollar pair perfectly reached the second resistance level of 1.1958 on the hourly timeframe of August 19, rebounded off it and after standing in one place for almost a day, began a strong fall. It seems that the upward trend has come to an end, at least now it seems that buyers have started to reduce their long positions en masse. If the price manages to gain a foothold below the support area of 1.1886-1.1910, this will be another signal for a new downtrend to form. In addition, the Kijun-sen line is also in the way of sellers, which should also be overcome if they want to count on something more than a downward movement of a hundred points. At the same time, it should be noted that at this time, sellers can continue to remain on the fence, since there is a 99% probability that the pair's quotes are falling because buyers are reducing their longs. Demand for the euro is falling, which causes the currency to drop against the US dollar.
EUR/USD 15M
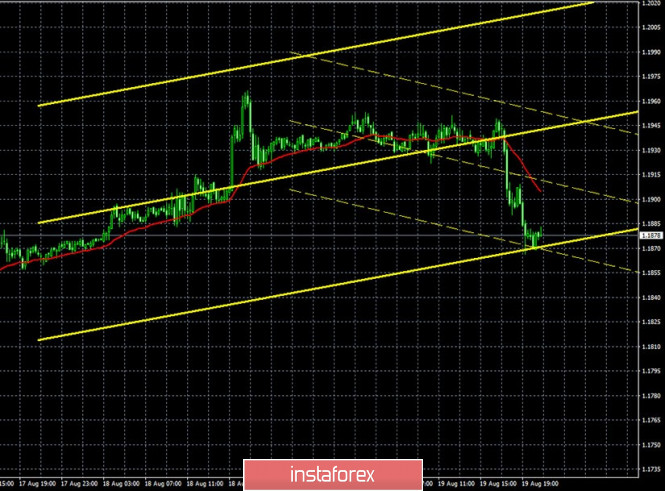
The lower channel of linear regression turned down on the 15-minute timeframe, which signals a change in the trend in the most short-term plan. A new Commitments of Traders (COT) report was released last Friday. According to this report, non-commercial traders reopened Buy-contracts and closed Sell-deals. The net position for the "non-commercial" category of traders, which is the most important and significant category of traders, has grown again and this time by 15,000 contracts, which is a high value (5,128 Buy-contracts were opened and 9,681 Sell-contracts were closed). This leads to the conclusion that the mood of big traders has not changed at all over the past week. In principle, the same conclusion can be drawn by looking at the chart of the euro/dollar currency pair itself. The pair has been in the side channel since July 27, that is, for three weeks, after which the upward movement resumed. During all this time, traders managed to adjust the pair by a maximum of 200 points down, which is very small to be reflected in the COT report. The euro began to fall in price yesterday evening, which gives reason to assume the end of the upward trend. If we see non-commercial traders sharply reducing Buy-contracts or increasing the number of Sell-contracts in the next COT report, it will show that their mood is beginning to change in favor of a bearish one.
The fundamental background for the EUR/USD pair remained extremely weak on Wednesday. And the fact that both European currencies moved almost synchronously again indicates that the reasons should again be sought in the US. Since there has not been much positive news in the United States recently, and nothing overly optimistic happened in the US yesterday, we are inclined to believe that the fall in the euro/dollar pair quotes is purely technical. Yesterday's report on inflation in the European Union was, for example, ignored. The next report on US applications for unemployment benefits is scheduled for today. If our assumption that the bulls have started to massively reduce longs is correct, then now the market will cling to any positive message from overseas. If tomorrow it turns out that the number of new applications for unemployment benefits has decreased again, compared to the previous week, then the dollar can continue to grow.
Based on the above, we have two trading ideas for August 20:
1) Bulls abandoned further purchases of the pair and began to take profits. The pair reached the 1.1958 level and after that a strong fall began. Thus, we do not expect the upward trend to resume in the near future. It is recommended to consider new purchases of the pair only if the price returns to the area above 1.1910 with targets at the resistance levels of 1.1958 and 1.2051.
2) Bears finally seized the initiative in the market and began to attack. However, so far, more and more depends on the bulls, which simply close the longs. Nevertheless, we recommend opening sales after breaking through the support area of 1.1886-1.1910 and the Kijun-sen line (1.1874) with the targets of the Senkou Span B line (1.1805) and the support level 1.1745. Potential Take Profit in this case will be from 40 to 100 points.
Hot forecast and trading signals for the GBP/USD pair.
We recommend that you also explore the fundamental background in these articles:
Overview of the EUR/USD pair. August 20. Is Joe Biden the American version of Jeremy Corbyn? What can a Democratic presidential candidate give America?
Review of the GBP/USD pair. August 20. Traders are not interested in the negative from Great Britain. Chinese giant Alibaba next in line to be banned in the US
Explanations for illustrations:
Support and Resistance Levels are the levels that serve as targets when buying or selling the pair. You can place Take Profit near these levels.
Kijun-sen and Senkou Span B lines are lines of the Ichimoku indicator transferred to the hourly timeframe from the 4-hour one.
Support and resistance areas are areas from which the price has repeatedly rebounded off.
Yellow lines are trend lines, trend channels and any other technical patterns.
The material has been provided by InstaForex Company - www.instaforex.com