
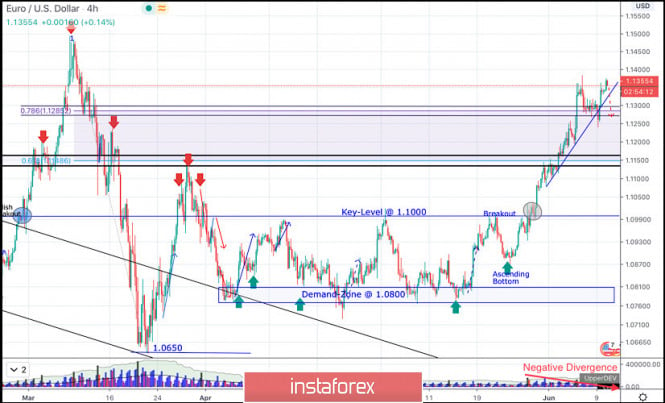
On March 20, the EURUSD pair has expressed remarkable bullish recovery around the newly-established bottom around 1.0650.
Bullish engulfing H4 candlesticks as well as the recently-demonstrated ascending bottoms indicated a high probability bullish pullback towards 1.0980 and 1.1075 (Fibo Level 50%).
Shortly After, a bearish Head & Shoulders pattern was demonstrated around the price zone between (1.1075-1.1150).
Shortly after, a sideway consolidation range was established in the price range extending between 1.0770 1.1000.
The price zone of (1.0815 - 1.0775) has been standing as a prominent Demand Zone providing quite good bullish support for the pair so far.
On May 14, Evident signs of Bullish rejection have been manifested around this price zone.
Moreover, recent ascending bottom has been established around 1.0870 which enhances the bullish side of the market in the short-term.
Short-term technical bullish outlook remains valid as long as bullish persistence is maintained above the recently-established ascending bottom around 1.0850-1.0870.
Currently, the recent bullish breakout above 1.1000 has enhanced further bullish advancement towards 1.1175 (61.8% Fibonacci Level) then 1.1315 (78.6% Fibonacci Level) where temporary bearish rejection was anticipated.
Although the EUR/USD pair is currently expressing a bullish breakout above 1.1315 (78.6% Fibonacci Level), there's negative divergence as well as recent bearish rejection being expressed on the H4 chart.
Moreover, after such a quick bullish spike, the EURUSD pair looks oversold. This suggests a probable bearish reversal around the current price levels (1.1315) to be watched by Intraday traders.
Bearish breakout below 1.1250 (double-top neckline) is needed to confirm the depicted reversal pattern to enhance further bearish decline towards 1.1150
Trade recommendations :
Conservative traders are advised to wait for bearish breakout below 1.1250-1.1270 (Depicted Neckline) as a valid SELL Signal
T/P levels to be located around 1.1175 then 1.1100 while S/L to be located above 1.1390.
The material has been provided by InstaForex Company - www.instaforex.com