
To open long positions on GBPUSD, you need:
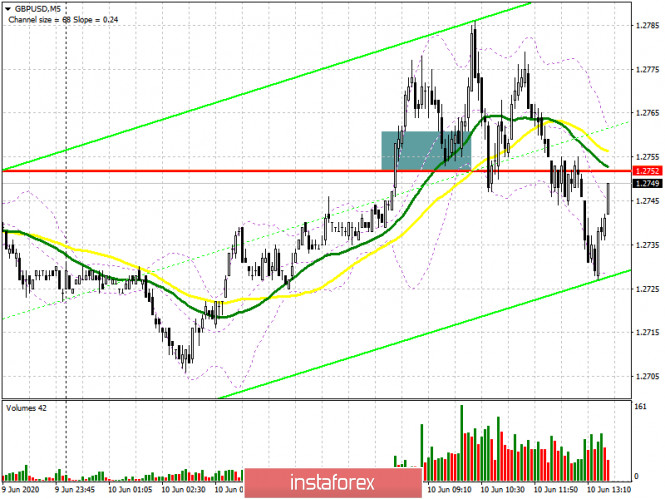
In my morning forecast, I paid attention to the level of 1.2752 and recommended opening long positions from it when this range is broken. If you look at the 5-minute chart, you will see how the bulls easily got above this range and then held it when the price fell to this area from the top down, which formed a fairly good signal to buy the pound. However, more than 35 points of the upward movement could not be snatched from the market, which led to the departure of buyers and the pair hovering around the level of 1.2752. At the moment, the entire focus of the bulls will be shifted to the new resistance of 1.2773, which was formed after all the morning manipulations. Only weak inflation data and a wait-and-see position of the Fed with nondescript prospects for economic recovery in the 3rd quarter of this year will lead to a breakout and consolidation above the resistance of 1.2773, which will strengthen the upward momentum in the pound and open a direct path to the highs of 1.2840 and 1.2906, where I recommend fixing the profits. If the bulls fail to overcome the resistance of 1.2773 after the release of inflation data in the US, it is best to defer new long positions until the formation of a false breakout near the resistance of 1.2696 or buy the pound immediately for a rebound from this week's lows in the area of 1.2622 in the calculation of correction of 30-40 points by the end of the day.
To open short positions on GBPUSD, you need:
Nothing much has changed for those who want to sell the pound. The task of the bears today for the second half of the day is not to let the bulls above the resistance of 1.2773, where the formation of a false breakout will be a signal to open short positions that can lead to a return of GBP/USD to the area of the middle of the side channel 1.2696, just above which the moving averages pass. It is fixing below this range that will increase the pressure on the pair and lead to the demolition of stop orders of bulls with a larger movement of the pound down in the expectation of updating the support of 1.2622, where I recommend fixing the profits. A longer-term target for bears will be a minimum of 1.2534, an update of which will lead to a break in the bull market. If the resistance of 1.2773 breaks in the second half of the day after the US inflation data, it is best to abandon short positions before the test of the maximum of 1.2840 or sell GBP/USD immediately on the rebound from the larger resistance of 1.2906 in the expectation of a downward movement of 30-40 points to the close of the day.
Signals of indicators:
Moving averages
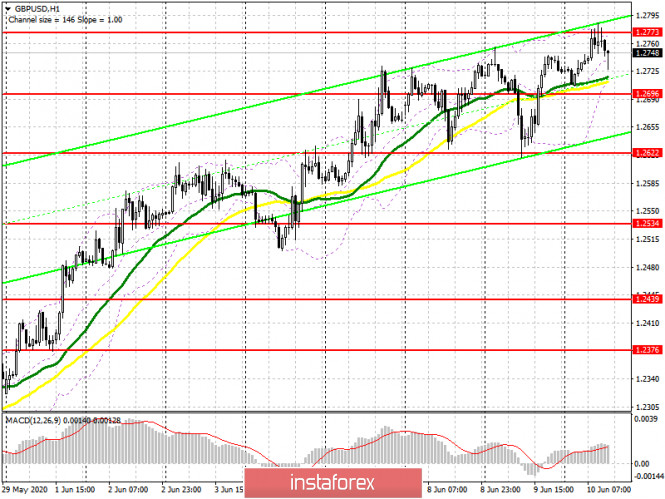
Trading is conducted above the 30 and 50 daily averages, from which today in the Asian session, the bulls gained long positions in the expectation of continuing the upward trend in the pound.
Note: The period and prices of moving averages are considered by the author on the hourly chart H1 and differ from the general definition of the classic daily moving averages on the daily chart D1.
Bollinger Bands
A break in the upper level of the indicator at 1.2775 will lead to a new upward wave, while problems with buying may start when the lower border of the indicator breaks at 1.2696, which will strengthen the bearish momentum.
Description of indicators
- Moving average (moving average determines the current trend by smoothing out volatility and noise). Period 50. The graph is marked in yellow.
- Moving average (moving average determines the current trend by smoothing out volatility and noise). Period 30. The graph is marked in green.
- MACD indicator (Moving Average Convergence / Divergence - moving average convergence / divergence) Fast EMA period 12. Slow EMA period 26. SMA period 9
- Bollinger Bands (Bollinger Bands). Period 20