
To open long positions on EUR/USD, you need:
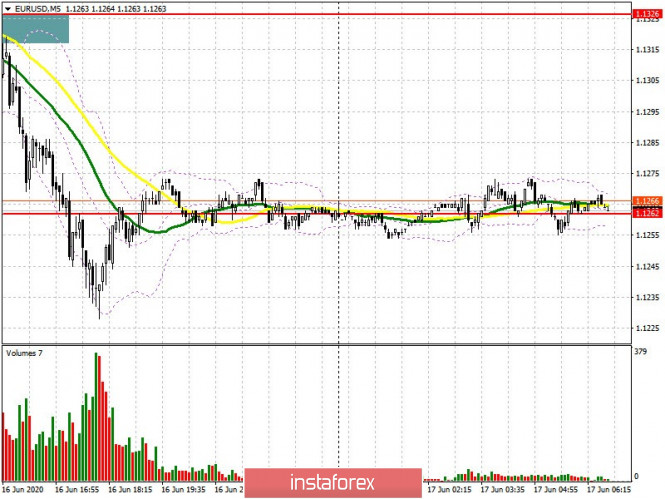
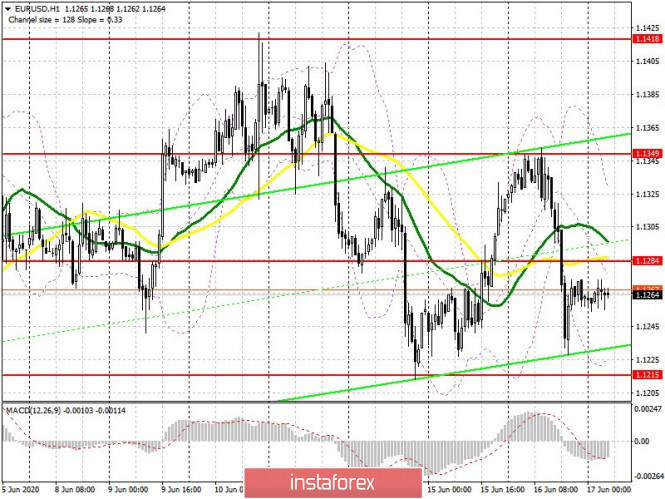
Yesterday's data on a sharp increase in US retail sales provided significant support to the US dollar, which managed to strengthen its position against the European currency. However, Federal Reserve Chairman Jerome Powell's speech to Congress limited demand for the dollar. Unfortunately, it was not possible to wait for a clearer signal to sell the European currency in the afternoon. If you look at the 5-minute chart, you will see how the pair's upward correction to the resistance area 1.1326 in the afternoon did not result in a test of this level, to which there was literally a couple of points, after which the market went down again. At the moment, a new resistance 1.1284 has been formed and the task of buyers of the euro is to consolidate on it in the morning. If eurozone inflation data for May this year is better than economists' forecasts, then you can watch euro purchases above the level of 1.1284 counting on a return to the upper limit of the current rising channel of 1.1349, where I recommend taking profits. If the pressure on the euro continues in the morning, then there is no need to rush into purchases. The optimal scenario is to wait for the test of the lower boundary of the side channel of 1.1215 and form a false breakout there, which will be a signal to open long positions. I recommend buying EUR/USD immediately for a rebound from a low of 1.1164. It is worth recalling that the market is on the side of buyers of the euro. The Commitment of Traders (COT) report for June 9 showed the growth of long positions, as well as the reduction of short ones, which indicates a bullish momentum for the pair. The report shows a decrease in short non-profit positions from the level of 93,172 to 98,020, while long non-profit positions sharply rose from the level of 174,412 to the level of 184,669. As a result, the positive non-profit net position rose again to 95,639, against 81,240, which indicates an increase in interest in purchases of risky assets.
To open short positions on EUR/USD, you need:
Sellers took advantage of good US data yesterday and formed a new resistance at 1.1284, which will be emphasized in the morning. Forming a false breakout there, as well as a rebound from moving averages that pass just above this level, will be a signal to open short positions in EUR/USD whose main goal will be to test the lower border of the side channel of 1.1215. We can talk about resuming the downward trend for the euro after consolidating below the level of 1.1215, which will quickly push the pair to a new low of 1.1164 and 1.1106, where I recommend taking profits. In case the euro grows above resistance 1.1284 after the release of data on the eurozone economy, then it is best not to rush into sales, but wait for the major high of 1.1349 to be updated and open short positions there immediately for a rebound, counting on a correction of 30-40 points within the day.
Signals of indicators:
Moving averages
Trade is conducted below 30 and 50 moving average, which indicates a further decline in the euro.
Note: The period and prices of moving averages are considered by the author on the hourly chart H1 and differs from the general definition of the classic daily moving averages on the daily chart D1.
Bollinger bands
In case the pair grows, the upper border of the indicator in the region of 1.1330 will act as resistance. You can open long positions after updating the lower border in the area of 1.1225.
Description of indicators
- Moving average (moving average determines the current trend by smoothing out volatility and noise). Period 50. The graph is marked in yellow.
- Moving average (moving average determines the current trend by smoothing out volatility and noise). Period 30. The graph is marked in green.
- MACD indicator (Moving Average Convergence / Divergence - Moving Average Convergence / Divergence) Fast EMA period 12. Slow EMA period 26. SMA period 9
- Bollinger Bands (Bollinger Bands). Period 20
- Non-profit traders are speculators, such as individual traders, hedge funds and large institutions that use the futures market for speculative purposes and meet certain requirements.
- Long nonprofit positions represent the total long open position of nonprofit traders.
- Short nonprofit positions represent the total short open position of nonprofit traders.
- The total non-profit net position is the difference between short and long positions of non-profit traders.