
4-hour timeframe
Amplitude of the last 5 days (high-low): 60p - 54p - 127p - 102p - 157p.
Average volatility over the past 5 days: 100p (average).
The second trading day of the week ends with a new attempt by the euro to continue the upward movement, but it seems that the fuse in the bulls has completely dried up. We already drew the attention of market participants in previous reviews to the fact that there is very little logic and validity in the current upward movement of the euro currency. Initially, the upward movement was suggested for at least two weeks, as a necessary correction from a technical point of view. However, the correction turned out to be more than the downward trend itself. That is, in fact, it is very difficult to say why the European currency rushed up at a wild speed, and, for example, the British pound continues to fall in price paired with the dollar? Why did factors that seem to have an impact on the euro/dollar have no impact on the pound/dollar? Perhaps the problem is precisely in the pound, but on what, in principle, could the strengthening of the euro be based? On the fall of the US stock market? This is not the first time in history. On the fears of traders of the consequences of the coronavirus and its negative impact on the US economy? It will have no less impact on the economy of the European Union; this is clear to everyone. On a possible cut in the Fed key rate? So the European Central Bank announced its readiness to soften monetary policy. At the same time, the US economy continues to feel much better than the European one. In general, we stick with our original opinion: the market is now full of various kinds of news, data, rumors and speculation, all of them are very important, and traders simply panic, which leads to such unreasonable logical movements. The most vivid proof of this: today the Fed suddenly lowered its key rate by 0.5%, which did not happen a long time ago, and the euro managed to add no more than 40 points. Yesterday, when there were practically no important messages and fundamental events, the euro grew by more than 100 points. Thus, we still believe that markets need to calm down in the first place. The state of panic should pass. We do not know when this reassurance will come if the situation with the coronavirus does not improve. Now the Fed has lowered its key rate at an emergency meeting, completely unplanned. Tomorrow, the ECB or the Bank of England can do the same. Obviously, these news and events will not bring reassurance to either stock market investors or currency traders.
It is difficult to say whether there is any sense at all to consider the macroeconomic background of Tuesday, March 3? At the very beginning of the day, the euro/dollar began to adjust, but this correction was extremely weak, despite the fact that the consumer price index in the European Union slowed down to 1.2% yoy in February. This is, of course, a negative moment for the eurozone and the single currency, but, as we see, the EU currency did not fall under any selloff. Accordingly, we can already conclude that the bears did not plan to join the trade today, even with weak statistics from the European Union. Furthermore, the bulls that have recently dominated the market could begin to reduce long positions against the background of the same weak inflation report, however, did not begin to do this, although once again one of the key indicators of the state of the EU economy failed. Just the other day, ECB Vice President Luis de Guindos said that the regulator will continue to do everything necessary and use all its available tools so that inflation continues to move to the target level of 2.0%. Many in this speech considered a hint to lower rates in the near future due to the same current situation in the world with the Chinese virus. However, the fact of weak inflation in the EU cannot be denied. Well, after the Fed announced in emergency mode that the key rate was reduced by 0.5%, the bulls were completely at a loss. It's hard not to respond with selling the US dollar and purchases of the euro when the Fed cuts the rate by 50 basis points at once. But if at the same time the pair has already risen in price by 400 points in recent days, having passed them completely without rollbacks, a stupor arises.
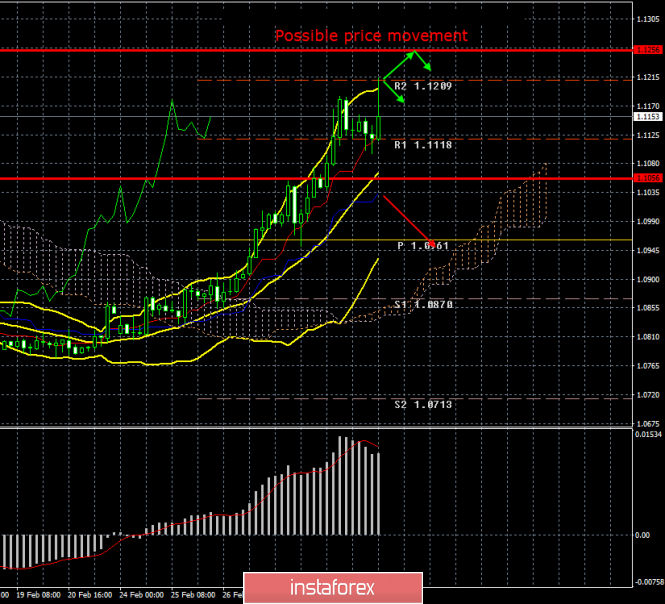
From a technical point of view, a downward correction has begun, which the MACD indicator has signaled. However, at the same time the pair has just updated yesterday's highs and may continue to increase. And at the same time, the chances of resuming correction remain high after traders calm down after an unexpected decision by the Fed. Thus, now is not the most favorable situation for trading the EUR/USD pair.
Trading recommendations:
The EUR/USD pair retains the same chances for the beginning of the correction and for the continuation of the upward movement. Thus, now it is formally possible to stay in long positions with the target of the resistance level of 1.1209. However, from our point of view, this is rather dangerous, and this level has already been worked out today. It will be possible to sell the pair with the first goal of the Senkou Span B line, when traders will be able to gain a foothold back below the critical line.
Explanation of the illustration:
Ichimoku indicator:
Tenkan-sen is the red line.
Kijun-sen is the blue line.
Senkou Span A - light brown dotted line.
Senkou Span B - light purple dashed line.
Chikou Span - green line.
Bollinger Bands Indicator:
3 yellow lines.
MACD indicator:
Red line and bar graph with white bars in the indicators window.
Support / Resistance Classic Levels:
Red and gray dashed lines with price symbols.
Pivot Level:
Yellow solid line.
Volatility Support / Resistance Levels:
Gray dotted lines without price designations.
Possible price movements:
Red and green arrows.
The material has been provided by InstaForex Company - www.instaforex.com