
Trend analysis.
This week, the price will move up with the first target of 1.3514 - upper fractal (red dotted line). If it is achieved, the continuation of the work up from the target of 1.3761 - a pullback level of 76.4% (blue dotted line).
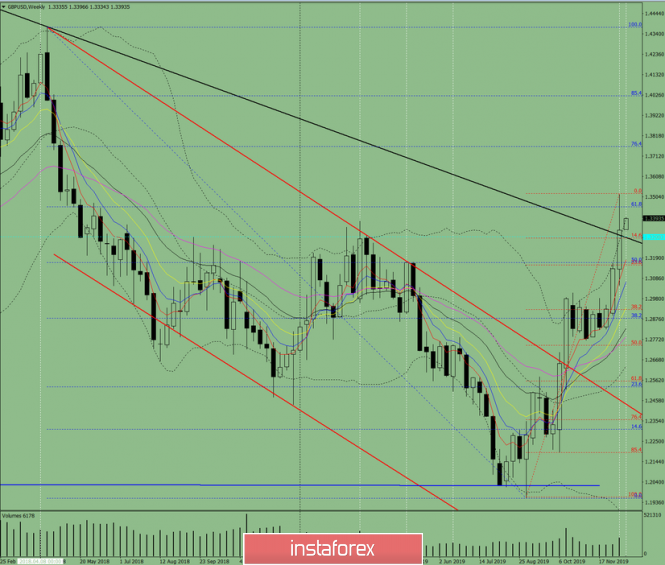
Fig. 1 (weekly chart).
Complex analysis:
- Indicator analysis - up;
- Fibonacci levels - up;
- Volumes - up;
- Candlestick analysis - down;
- Trend analysis - up;
- Bollinger Bands - up;
- Monthly chart - up.
The conclusion of the complex analysis - an upward movement.
The overall result of calculating the candle of the GBP / USD currency pair according to the weekly chart: the price of the week is likely to have an upward trend with the absence of the first lower shadow of the weekly white candlestick (Monday - up) and the presence of the second upper shadow (Friday - down).
An unlikely scenario: from the level of 1.3451 - a retracement level of 61.8% (blue dotted line); work down with a target of 1.3153 - a retracement level of 23.6% (red dotted line).
The material has been provided by InstaForex Company - www.instaforex.com