
4-hour timeframe
Amplitude of the last 5 days (high-low): 25p - 35p - 75p - 51p - 93p.
Average volatility over the past 5 days: 56p (average).
On Monday, December 16, the EUR/USD currency pair moved all day according to one logic that it understood. Most likely, from the very opening of the market, traders began to adjust against the correction of the euro/dollar pair's growth from last Friday. The fundamental background left much to be desired from the very beginning. Now we mean both the long-term fundamental background and the short-term one. Several reports from the European Union on business activity again disappointed investors, but instead of selling the euro, we saw cautious purchases. In principle, the situation remained the same until the US trading session, at which similar business activity indices in the US were published, which, unlike European ones, showed an increase compared to the previous month. And only at this moment traders began to get rid of the euro and buy the US dollar. It is difficult to say how long the downward movement of the pair will continue. The general fundamental background is not in favor of the euro, the short-term background also, but the upward trend remains from a technical point of view. But consider all the factors in more detail.
We still believe that only optimists can count on long-term growth of the European currency. If we list absolutely all the factors that affect the exchange rate of any currency, it will become clear that not a single one speaks in favor of the euro's further growth. We list the most basic factors that favor the fall of the euro/dollar pair:
1) Monetary policy in the United States remains much stronger (hawkish) than in the European Union.
2) The Federal Reserve announced a pause in easing monetary policy. The ECB and Christine Lagarde have announced the weakness of the EU economy and the need to stimulate it, which could cause a new decrease in the already negative rates.
3) A quantitative easing program is in place in the eurozone, but not in the United States.
4) Macroeconomic statistics in the US are much stronger than in the eurozone.
5) Macroeconomic reports in the United States have again begun to show growth in recent weeks, strengthening, in the eurozone - continues to decline further.
6) In the near future, the European Union may lose Britain (more precisely, lose it with a probability of 99%).
7) The trade wars fueled by Donald Trump have no less impact on the EU economy than on the US economy.
These are just those fundamental factors that came to mind without much thought. What about today? Today, preliminary values of business activity indices in the services and manufacturing sectors of the US, Germany and the European Union were published. In Germany, everything is bad and getting worse. Instead of projected growth to 44.5, business activity in the manufacturing sector decreased to 43.4. In the service sector - there is an increase from 51.7 to 52.0, but it is not so important due to the fact that this is not the most problematic area in the German economy, and it did not cause serious concern before. The composite index remained unchanged at 49.4 (an increase of 49.9 was forecasted). In the European Union. The business activity index in the manufacturing sector decreased to 45.9, in the service sector - rose to 52.4, the composite index - remained unchanged - 50.6. As you can see, in the locomotive country, the European economy and, in fact, in the European Union, the patterns of business activity are almost identical, and both suggest another deterioration in the state of the manufacturing sector. Needless to say, that it is the manufacturing sector that affects GDP, inflation, wages, that is, in fact, pulls all other macroeconomic indicators down (or up)? What should traders expect from future macroeconomic publications in December (or December) if business activity worsens again? How can the euro be in demand among traders with such a fundamental background? But maybe the situation is no better in the US?
The situation is much better in America. The ISM business activity index has not been published today, which is considered more important than Markit, and is also located in the red zone. We learn it only from the final release, that is, at the end of the month. But according to preliminary values of Markit business activity indices, we can already say that there is a slight decrease of only 0.1 in the manufacturing sector. An increase of up to 52.2 in the services sector. As a result, the composite index of business activity has grown to 52.2. Thus, even though the ISM index is much lower than the Markit indices, at the moment we can state a good state of business activity in all areas of the US and a depressing state of business activity in the EU manufacturing sector.
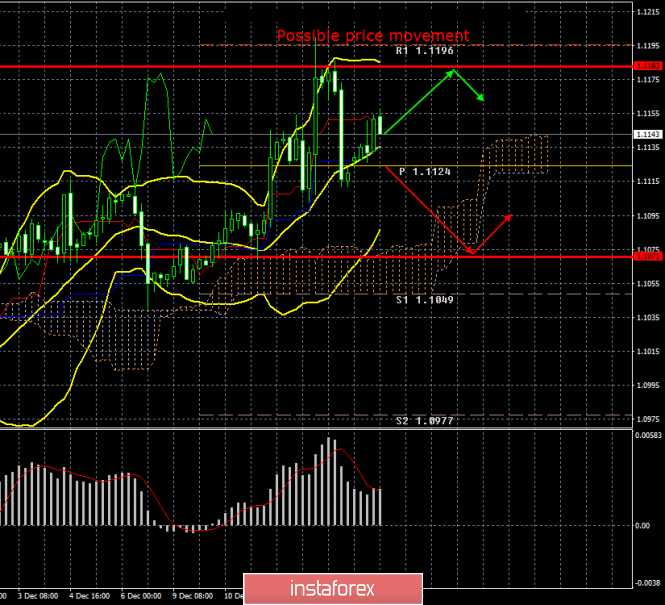
From a technical point of view, the pair continues to be located above the critical line, therefore, the upward trend continues. Although in the near future quotes of the pair may again leave the bottom of the Kijun-sen line.
Trading recommendations:
EUR/USD is trying to resume the upward movement. Thus, long positions formally remain relevant with targets at the resistance level of 1.1183 and 1.1196, but we recommend that it be wary of opening long positions. It will be possible to sell the euro/dollar pair after overcoming the Kijun-sen line, but in small lots, with goals 1.1071 and Senkou Span B line
Explanation of the illustration:
Ichimoku indicator:
Tenkan-sen is the red line.
Kijun-sen is the blue line.
Senkou Span A - light brown dotted line.
Senkou Span B - light purple dashed line.
Chikou Span - green line.
Bollinger Bands Indicator:
3 yellow lines.
MACD indicator:
Red line and bar graph with white bars in the indicator window.
Support / Resistance Classic Levels:
Red and gray dotted lines with price symbols.
Pivot Level:
Yellow solid line.
Volatility Support / Resistance Levels:
Gray dotted lines without price designations.
Possible price movement options:
Red and green arrows.
The material has been provided by InstaForex Company - www.instaforex.com