
Technical outlook:
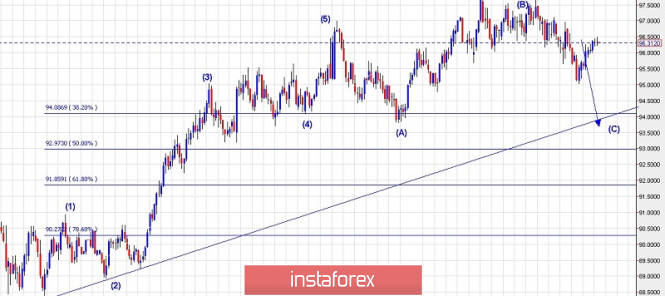
We have presented a daily chart view for US Dollar Index to get a medium-term outlook and direction for the underlying. The US Dollar Index has been rallying from 88.30 through 97.00 levels between February and August 2018, and has produced a 5-wave impulse as depicted here. Please note that an impulse is ideally followed by a corrective counter trend, and the US Dollar Index seems to be producing an expanded flat wave structure which is depicted by an (A)-(B)-(C) on the chart view here. Immediate price support is seen close to 94.00 levels, while resistance is seen at 97.70 levels and till prices remain below 97.70 going forward, bears are expected to remain in control. Furthermore, the fibonacci 0.618 support of the entire previous rally is seen at 91.85 levels, hence probability remains for a drop till there as well. An ideal trading strategy could be to sell on rallies till prices remain below 97.71 levels.
Trading plan:
Short now @ 96.31, stop @ 97.70 target @ 94.00 at least
Good luck!
The material has been provided by InstaForex Company - www.instaforex.com