
Technical outlook:
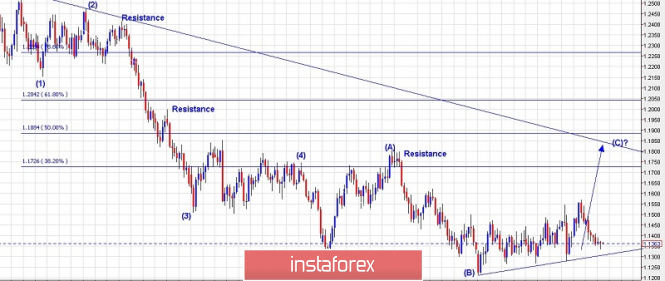
We have presented the daily chart view for EUR/USD as a bigger picture view is required for medium term outlook. EUR/USD dropped from 1.2550 levels through 1.1300 levels between February and August 2018 and unfolded into 5 waves as depicted here. Ideally, after a 5-wave movement towards the larger trend, one can expect a 3-wave counter trend movement which has been depicted as (A)-(B)-(C) on the chart view here. A higher probability could is that of an expanded flat, which could reach 1.1800 levels at least. Please note that resistance is at 1.1815 levels while interim support is seen at 1.1270, followed by 1.1213 levels respectively. For the above discussed structure to remain valid, prices should stay above 1.1213 levels from here on. Also note that the fibonacci 0.618 resistance of drop between 1.2550 and 1.1300 levels is seen at 1.2042 levels, hence possibility remains for a push until those limits.
Trading plan:
Long now @ 1.1360/70, stop at 1.1213, target @ 1.1800/20
Good luck!
The material has been provided by InstaForex Company - www.instaforex.com