
Gold price bounced strongly yesterday respecting the 61.8% Fibonacci retracement level we noted yesterday. Still with no clear medium-term trend, Gold is still below major resistance levels that if broken upwards could provide a strong bullish signal for a move towards $1,250-60. Bears need to break below yesterday lows in order to regain control of the trend.
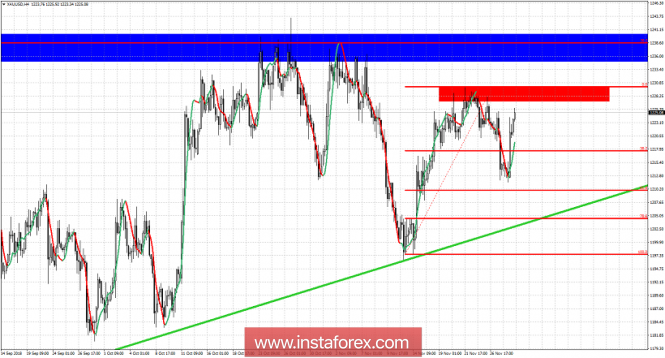
Red rectangle - short-term important resistance area
Green line - major support trend line
Gold price pulled back towards our minimum target area of the 61.8% Fibonacci level. Prices bounced strongly and bulls are now challenging the important short-term resistance at $1,230 and recent highs. Breaking above this level will change my view to bullish. As we previously said, as long as price is above the green trend line support, bulls remain alive and have many changes to regain control of the medium-term trend. This will happen with a break above $1,230-40 area. Bears on the other hand are now defending the resistance. Yesterday's lows at $1,211 must be broken in order for bears to regain control of the trend.
The material has been provided by InstaForex Company - www.instaforex.com