
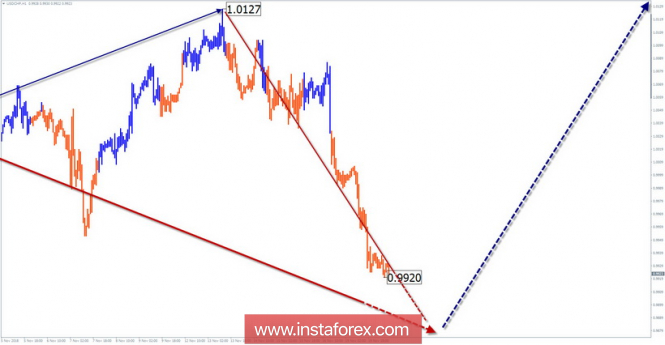
Wave pattern graphics H 4:
The last completed wave of this scale from May to September formed a descending segment. In a larger model, it became a correction (B). The level of the subsequent ascending segment is not yet down to H4.
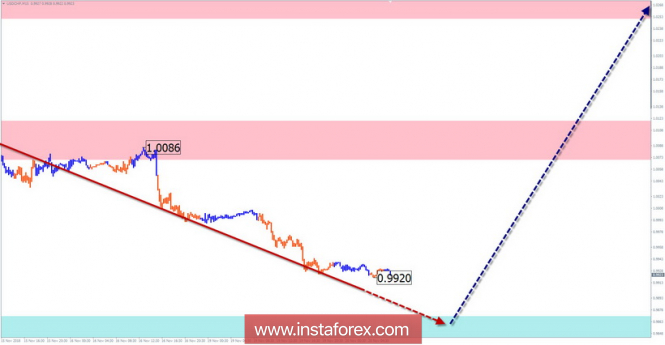
Wave pattern graphics H1:
Rising wave of September 21 in the main bullish wave of the daytime TF began a final climb (C). The latent correction is nearing completion in the wave structure.
Wave pattern graphics M15:
The descending section of the schedule of November 13 completes a bearish wave of a larger scale having the wrong kind of structure. The minimum level of elongation is passed; the reference is the next calculated support area.
Recommended trading strategy:
The low potential of the current price reduction makes selling a pair very risky. It is recommended to refrain from trading and monitor reversal signals in order to search for entry into long positions.
Resistance zones:
- 1.0250 / 1.0300
- 1.0070 / 1.0020
Support areas:
- 0.9870 / 0.9820
Explanations to the figures: The simplified wave analysis uses waves consisting of 3 parts (A - B - C) . For the analysis, 3 main TFs are used. On each the last, incomplete wave is analyzed. Zones show calculated areas with the highest probability of reversal.
The arrows indicate the wave marking by the method used by the author. The solid background shows the formed structure, the dotted - the expected movement.
Note: The wave algorithm does not take into account the duration of tool movements over time. To conduct a trade transaction, you need confirmation signals from the trading systems you use.
The material has been provided by InstaForex Company - www.instaforex.com