
To open long positions for GBP/USD, it is required:
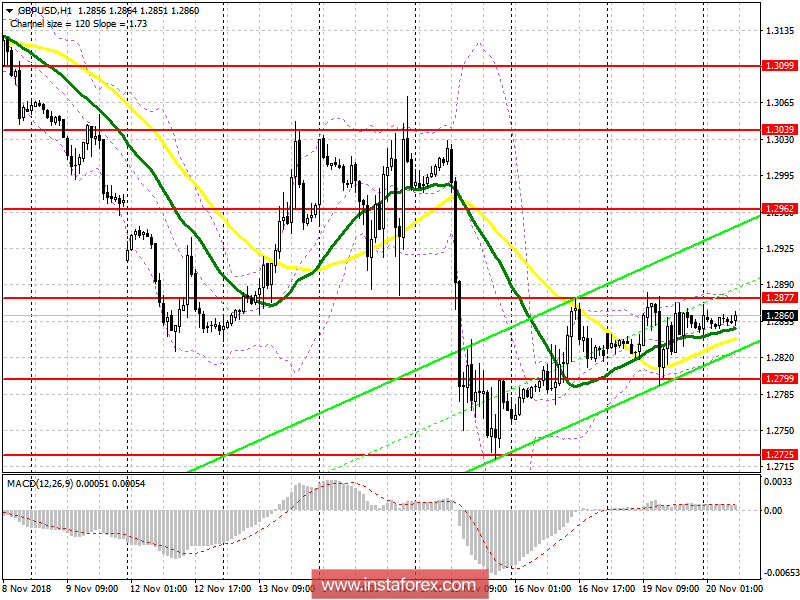
Yesterday, buyers tried to return to the market, but failed to break above an important level of resistance. At the moment, the main task is to break the upper limit of the channel in the area of 1.2877, which will lead to the formation of a new upward wave with an exit to the highs in the area of 1.2962 and 1.3040, where I recommend taking profit. In case the pound declines, support will be at the level of 1.2799, however, it would be best to open long positions immediately to a rebound from the low of 1.2725.
To open short positions for GBP/USD, it is required:
Like yesterday, an unsuccessful consolidation above the resistance of 1.2877 will be a signal to open short positions in order to drop to the area of the first support of 1.2799, the breakdown of which will lead to a larger sell-off of the GBP/USD with a minimum test of 1.2725, where I recommend taking profit. In case of positive news on Brexit, a breakthrough of 1.2877 will lead to an increase in the pound. In this scenario, it is best to open short positions by rebounding from the high of 1.2962 and 1.3039.
Indicator signals:
Moving averages
Trading is conducted in the area of 30-day and 50-day moving averages, which indicates the formation of the lateral nature of the market.
Bollinger Bands
The Bollinger Bands indicator indicates a decrease in volatility and does not provide signals on entering the market.
Indicator description
- Moving Average (average sliding) 50 days - yellow
- Moving Average (average sliding) 30 days - green
- MACD: fast EMA 12, slow EMA 26, SMA 9
- Bollinger Bands 20