
To open long positions on GBP / USD, you need:
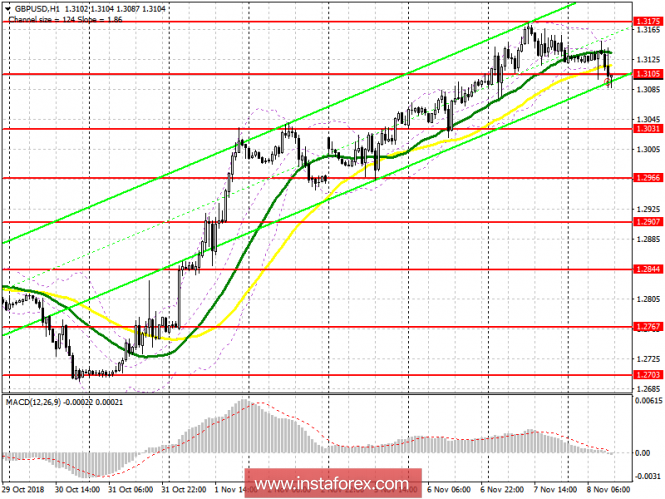
As I expected in my morning review, buyers tried to keep the support level of 1.3105 in the morning, which led to a rebound of the pair. However, when retesting this area, major players left the market. Now, the bulls are left to count on the return and consolidation above the resistance of 1.3110, which will lead to a new upward wave in GBP / USD with an update of 1.3175 area, and with access to a new maximum of 1.3233, where I recommend fixing the profits. In the event of a further decline in the pound, you can count on purchases from a minimum of 1.3031.
To open short positions on GBP / USD, you need:
Bears on the repeat test are trying to break through and gain a foothold below the support of 1.3105, which will allow building a new downward wave with the update of a large area of 1.3031, where I recommend fixing the profits. However, much will depend on the Fed's decision on interest rates. In the case of growth of GBP / USD in the afternoon, sales are still relevant from the resistance level 1.3175.
Indicator signals:
Moving Averages
Trade has moved below the 30- and 50-day average, which indicates the formation of a bearish formation.
Bollinger bands
The low volatility of the Bollinger Bands indicator does not give signals to enter the market.
Description of indicators
- MA (moving average) 50 days - yellow
- MA (moving average) 30 days - green
- MACD: fast EMA 12, slow EMA 26, SMA 9
- Bollinger Bands 20