
To open long positions on EUR / USD, you need:
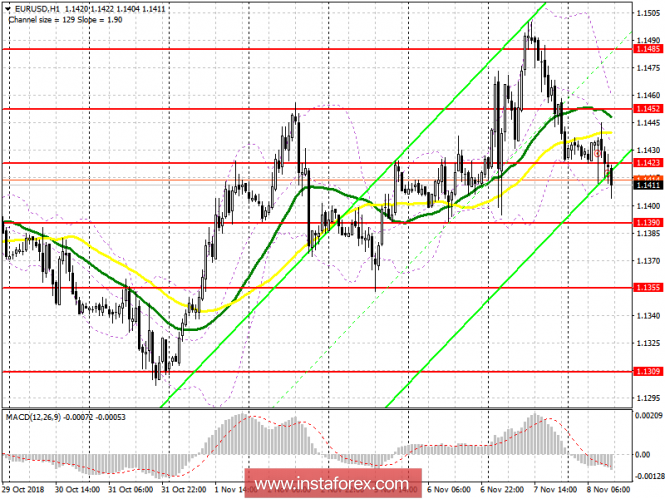
In the first half of the day, the buyers gave up the support level of 1.1423, and now their main task is to keep the area of 1.1390, the formation of which is a false breakdown will be a signal to open long positions. A return to the resistance level of 1.1423 will also lead to a larger increase in EUR / USD with an update of a maximum of 1.1452. The main goal remains the 1.1485 resistance test, where I recommend fixing the profits. If the pressure on the euro continues further around the level of 1.1390, then it is best to consider new long positions to rebound from 1.1355.
To open short positions on EUR / USD, you need:
Bears entrenched below 1.1423, and as long as trade is conducted below this level, pressure on the euro will continue. The main goal, prior to the publication of the Fed's decision on interest rates, will be the level of 1.1390, a breakthrough of which will lead to a larger sale of EUR / USD and an update of the minimum of 1.1355, where I recommend fixing the profits. If the pair rises above resistance of 1.1423 in the second half of the day, short positions can be returned to the rebound from the highs of 1.1452 and 1.1485.
Indicator signals:
Moving Averages
Trade is conducted below the 30- and 50-day average, which indicates a further decline in the euro to a weekly low.
Bollinger bands
A break of the lower limit of the Bollinger Bands indicator in the 1.1410 area will lead to a larger decline in the euro in the afternoon.
Description of indicators
- MA (moving average) 50 days - yellow
- MA (moving average) 30 days - green
- MACD: fast EMA 12, slow EMA 26, SMA 9
- Bollinger Bands 20