
To open long positions for EUR / USD pair, you need:
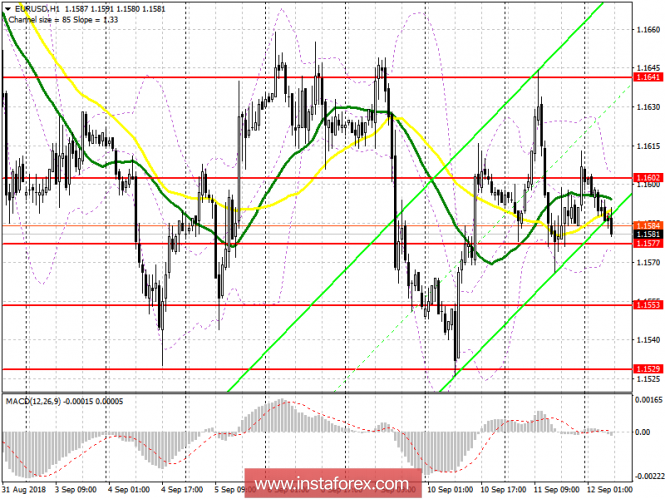
Buyers of the European currency y need an urgent return to the resistance level of 1.1602 today. This is required to maintain an upward trend, which will lead to a repeat test of the weekly highs near 1.1641 and their renewal in the 1.1686 area, where fixing profits are recommended. In case the euro declines in the morning, it is best to return to long positions after updating support 1.1577 or to rebound from 1.1553.
To open short positions for EUR / USD pair, you need:
Bears returned to the market yesterday, limiting the formation of a new rising wave. Today's data on producer prices in the US can support the US dollar, which will still pressure on EUR / USD. The breakthrough of support 1.1577 will be the first signal for the opening of short positions with a view of reducing and returning to the week's minimums in the area of 1.1553 and 1.1529, where fixing profits are recommended. The formation of a false breakdown at 1.1602 will also allow you to count on short positions in the euro. Otherwise, you can sell immediately to a rebound from 1.1641.
Indicator signals:
The 30-day moving average is on par with the 50-day moving average. This suggests that the trade will be conducted in the side channel.
Description of indicators
- MA (average sliding) 50 days - yellow
- MA (average sliding) 30 days - green
- MACD: fast EMA 12, slow EMA 26, SMA 9
- Bollinger Bands 20