
Gold price tried to make a breakout yesterday above $1,208 but price got rejected and pushed back towards $1,200. Gold price after making a high last week at $1,214 continues to make lower highs defining a clear downward sloping trend line resistance. For $1,220 to be achieved Gold bulls will need to break above this level which is currently at $1,206.
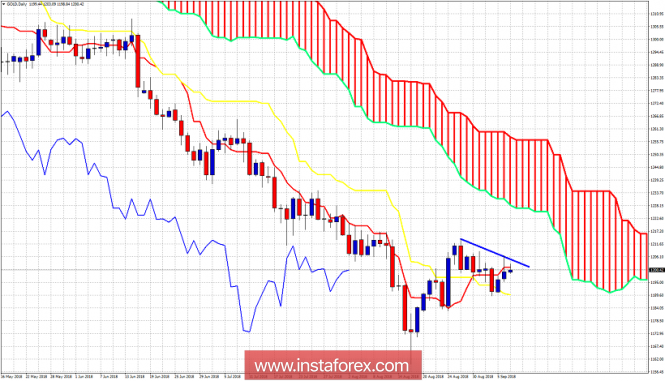
Gold price is below the Daily Kumo (cloud). Trend is clearly bearish. Gold price is trying to break the blue resistance trend line and the tenkan-sen (Red line indicator). The current move in Gold looks more like a consolidation before another leg down rather than the start of a new up trend. Even if Gold reaches $1,220 which is our bounce target, bulls need to be very cautious as we might need another final leg down to complete the entire decline from $1,365.
The material has been provided by InstaForex Company - www.instaforex.com