
To open long positions for GBP/USD, it is required:
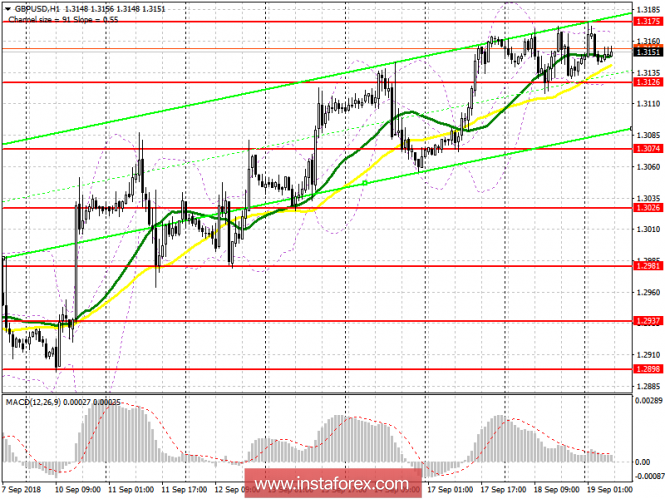
It is best to consider long positions in the GBP/USD pair today in the first half of the day after the formation of a false breakout in the support area of 1.3126 or on a rebound from the larger lows of 1.3074 and 1.3026. Much will depend on inflation data in the UK. Good indicators will lead to a breakout of resistance 1.3175, above which we can expect the continuation of the upward trend with the update of the highs in the area of 1.3214 and 1.3263, where I recommend taking profit.
To open short positions for GBP/USD, it is required:
Sellers of the pound will count on weak inflation data in the UK, but a significant decline in the pair should not be expected. The peak that sellers can expect is a breakdown and consolidation below the support of 1.3126, which will lead to a downward correction to the area of 1.3074 and 1.3026, where a new, lower border of the upward channel will be built. In the case of growth above the resistance of 1.3175 on good data on the consumer price index, it is best to return to selling the pound after the test of levels of 1.3214 and 1.3263. The formation of a false breakout at 1.3175, after inflation data, will also be a signal to sell.
Indicator signals:
Moving averages
The 30-day moving average is above the 50-day average, and both moving upwards, indicating a continuation of the upward trend in the pound.
Bollinger Bands
The return of the price under the middle boundary of the Bollinger bands will signal the selling of the pound.
The break of the upper limit of the Bollinger Bands will be a signal to buy the pound.
Indicator description
- Moving Average (average sliding) 50 days - yellow
- Moving Average (average sliding) 30 days - green
- MACD: fast EMA 12, slow EMA 26, SMA 9
- Bollinger Bands 20