
To open long positions for EURUSD, it is required:
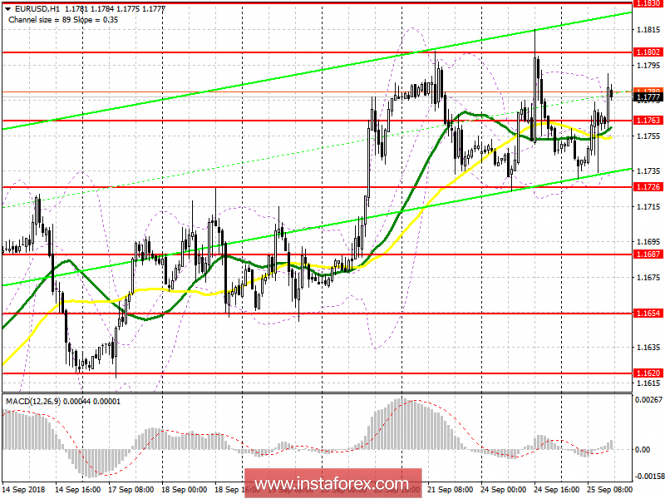
Markets are gradually taking a break ahead of tomorrow's meeting of the Federal Reserve, which is expected to raise interest rates in the United States. Buyers of the euro coped with the level of 1.1763 in the morning, and while trading is above this range, the upward potential will remain, which will lead to a re-test of the main daily target in the resistance area of 1.1801, where I recommend taking profits. If the EUR/USD pair declines below 1.1763 in the second half of the day, it is best to consider long positions again for a rebound from 1.1726.
To open short positions for EURUSD, it is required:
To return to the market sellers need to decline to the level of 1.1763, which will lead to profit taking in long positions and update the low of the day in the area of 1.1726, where I recommend to lock in the profit. In the event of a further upward trend in the EUR/USD pair, which can be continued after the release of a number of statistics on the US economy, it is possible to consider short positions after updating the resistance of 1.1801, or on a rebound from the monthly high of 1.1830.
Indicator signals:
Moving averages
The 30-day moving average is at the same level as the 50-day average, which indicates the lateral nature of the market. The trade moved above the moving averages, indicating a likely continuation of the euro's growth.
Bollinger Bands
Bollinger bands have narrowed, indicating a drop in market volatility before the release of important fundamental data.
Indicator description
- Moving Average (average sliding) 50 days - yellow
- Moving Average (average sliding) 30 days - green
- MACD: fast EMA 12, slow EMA 26, SMA 9
- Bollinger Bands 20