
The Gold price broke below the short-term consolidation range and below short-term support of $1,205 and has reached our first target area of $1,193. The price is diverging in RSI terms in the Daily chart. The trend remains bearish as the price is well below both the tenkan- and kijun-sen indicators.
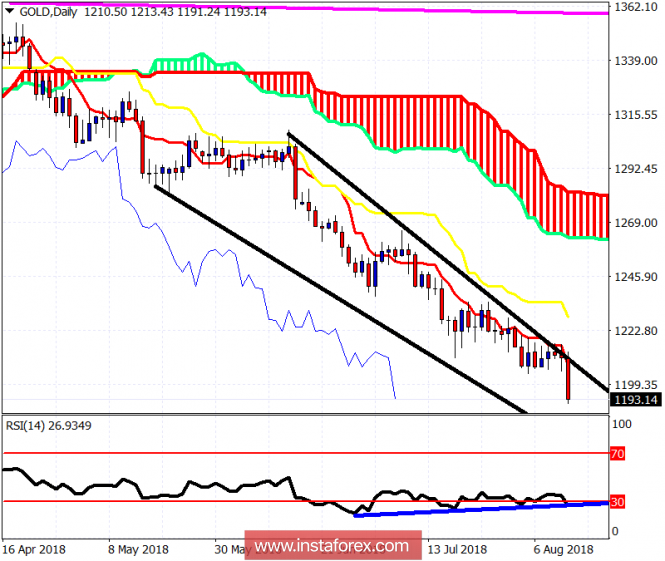
Blue line - bullish divergence
In the Daily chart, the Gold price is giving bullish divergence signs. The price got rejected at the upper wedge pattern boundary and combined with a break below $1,205, we had another short-term sell signal pointing below $1,200. The Gold price could continue lower towards $1,180. Key resistance is now at $1,217 to consider a bigger bounce towards $1,265.
The material has been provided by InstaForex Company - www.instaforex.com