
Despite the defamation of Bitcoin in favor of the other, the cryptocurrencies of the various news agencies, the positions of Bitcoin are still quite strong. The daily volume of Bitcoin trades is $ 4.880 billion, after Tether which has a turnover of 2.711 billion dollars, followed by the ambitious Ethereum in the third place with 1.841 billion dollars. And in any case, increased activity on the market.
Such an increasing activity is now observed for all the top ten.
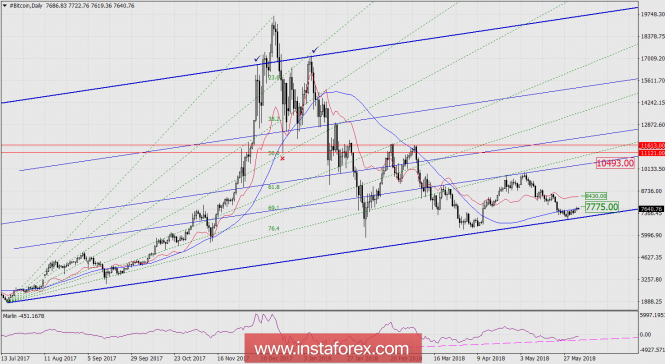
On the daily chart, the price formed a global rising price channel, the correctness of which is confirmed by its upper line which exactly coincided in the two maxima(the border of the channel is marked by thick lines, the touch points are ticked). Practically, half a year's price convergence with the Marlin oscillator confirms the "bottom" of the price on the support line of the indicated price channel. In case of price increase, the first internal line of the channel appears at about 10493. Further, the Fibonacci ray can be worked out at 76.4% in the range of 11121-11613, the lower limit of which coincides with the minimum of December 22 last year (marked with a red cross).
But the formation of a complete signal does not have enough two points: the output of the Marlin oscillator signal line over the zero line and fixing the price over the blue line on the price chart. Such an opening signal will take place with the price reaching the mark of 7775. The first resistance will be the balanced price line on the chart (red) at around 8430. Overcoming this level would likely add to the open position.* The presented market analysis is informative and does not constitute a guide to the transaction.
The material has been provided by InstaForex Company - www.instaforex.com