
The analysis of the highest TF of the chart of the main pair of yen shows a downward trend. The last, unfinished plot of February 16 is ascending. The preliminary target zone is approximately in 5 price figures above the current price.
The wave pattern of the graph H1:
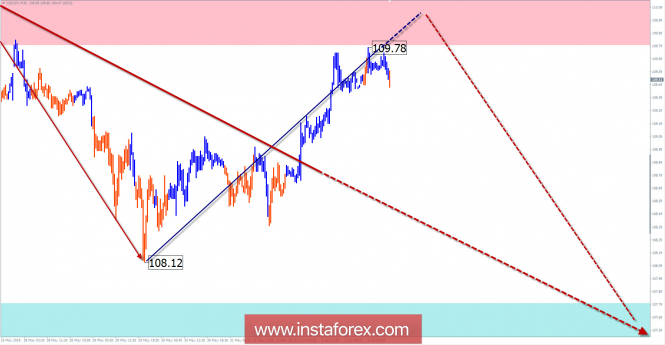
As part of the main bullish trend, a downward trend is forming from May 21 downward. In the structure of the wave, it will take the place of correction. The wave is not complete. Calculation of the probable course indicates the support zone as the upper boundary of the site.
The wave pattern of the M15 chart:
As part of the trend of a larger wave in recent weeks, the price began to form a hidden correction. Since May 29, quotes have gone up, forming the final part (C).
Recommended trading strategy:
When trading large sections of the schedule traders need to wait for the completion of the entire bear correction. In daily trading on the completion of this wave, you can take profit.
Resistance zones:
- 109.80 / 110.30
Support zones:
- 107.80 / 107.30
Explanations to the figures: Simplified wave analysis uses a simple waveform, in the form of a 3-part zigzag (ABC). At each TF the last incomplete wave is analyzed. Zones show the calculated areas with the greatest probability of a turn.
Arrows indicate the wave counting according to the technique used by the author. The solid background shows the generated structure, dotted - the expected wave motion.
Attention: The wave algorithm does not take into account the duration of the tool movements in time. To conduct a trade transaction, you need confirmation signals from your trading systems!
The material has been provided by InstaForex Company - www.instaforex.com