
Technical outlook:
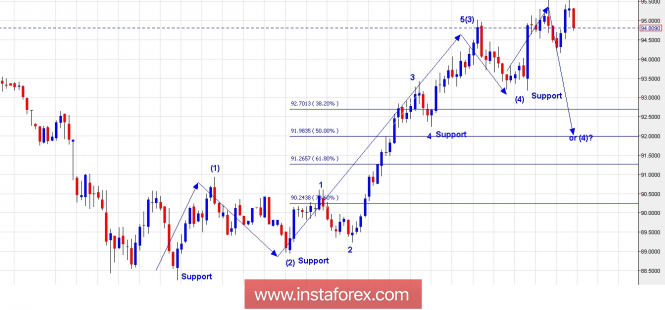
The US Dollar Index has dropped from the recent top printed yesterday at the 95.53 levels as expected and discussed earlier. The candlestick patter that was forming yesterday was that of a shooting star and and most probable pattern is turning out as a bearish candle today. If the prices manage to hold and close at current levels, the trading signal would be of an Evening Star which implicates that a meaningful top is in place at the 95.53 levels and that the drop should continue lower. Looking at the wave counts presented on the daily chart here, it is quiet evident that the US Dollar Index is producing a complex wave (4) structure now. Only a sustained break above 95.53 now would nullify the bearish stance.
Trading plan:
Aggressive traders, please remain flat from yesterday, stop above 95.53, target at 92.50 and 92.00.
Fundamental outlook:
Watch out for German Unemployment Change and Claims at 0355 AM EST, followed by Euro Zone Consumer Price Index at 0500 AM EST.
Good luck!
The material has been provided by InstaForex Company - www.instaforex.com