
Technical outlook:
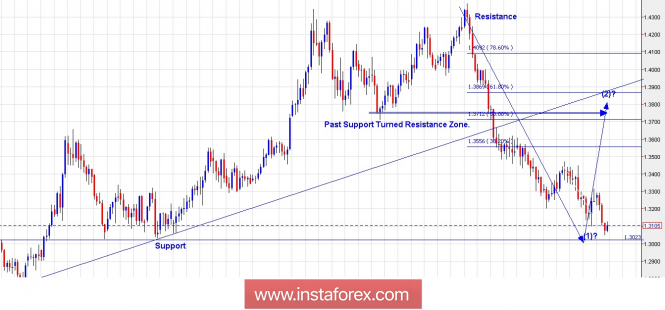
The GBP/USD Daily chart presented here is suggesting that the drop from 1.4370 which began in April 2018, through the 1.3050 levels, is either complete or just about to be complete around the 1.3020 levels. That is the support level (shown by a horizontal line) which bears might want to break before a meaningful counter trend rally takes place. The structure remains very simple for now with wave (1) probably complete and wave (2) rally to begin soon. Please note that the Fibonacci resistance and past support turned resistance zone converges around the 1.3700/50 levels as shown here. Also note that backside of support which turned resistance trend line is passing through the 1.3860/70 levels now. Going forward, the projected zone for the wave (2) termination point should be between 1.3700/50 through the 1.3860/70 levels.
Trading plan:
Aggressive trades should look for buying opportunities with stop below the 1.2950 levels, targeting the 1.3750 and 1.3850 levels.
Fundamental outlook:
Watch out for German Unemployment rate and claims at 0355 AM EST followed by Euro Zone Consumer Price Index at 0500 AM EST.
Good luck!
The material has been provided by InstaForex Company - www.instaforex.com