
The wave pattern of the D1 graph:
Since September last year, the price movement of the major corresponds to the downward wave algorithm. In a larger formation, it takes the place of correction, forming a standard plane. The wave is not complete.
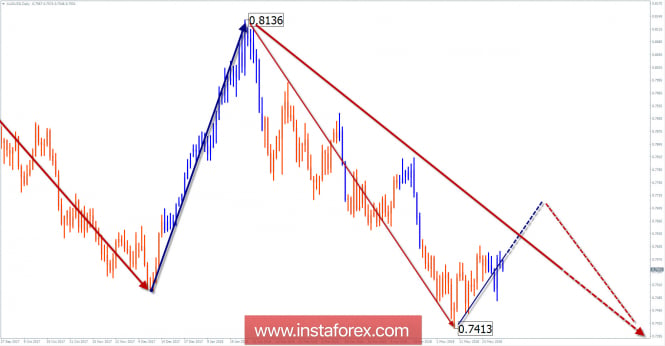
The wave pattern of the H1 graph:
In the descending wave of the H2 / H4 scale, the last section is close to the level of the hourly TF. The bullish wave of May 9 takes the place of correction. The upward potential is limited by the zone of resistance.
The wave pattern of the M15 chart:
This scale can be attributed to the last section from May 30 in a larger upward wave. At the time of analysis, the price is adjusted forming the middle part of the movement (B).
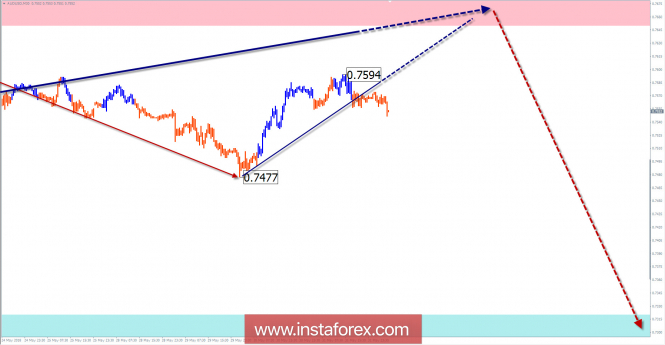
Recommended trading strategy:
Proponents of intraday trading can make short-term purchases. Trading larger areas of the schedule, it makes sense to wait for the completion of the upcoming rollback for the sale of the pair.
Resistance zones:
- 0.7650 / 0.7700
Support zones:
- 0.7320 / 0.7270
Explanations to the figures:
A simplified wave analysis uses a simple waveform, in the form of a 3-part zigzag (ABC). The last incomplete wave for every time frame is analyzed. Zones show the calculated areas with the greatest probability of a turn.
Arrows indicate the counting of wave according to the technique used by the author. The solid background shows the generated structure and the dotted exhibits the expected wave motion.
Attention: The wave algorithm does not take into account the duration of the tool movements in time. To conduct a trade transaction, you need to confirm the signals used by your trading systems. The material has been provided by InstaForex Company - www.instaforex.com