
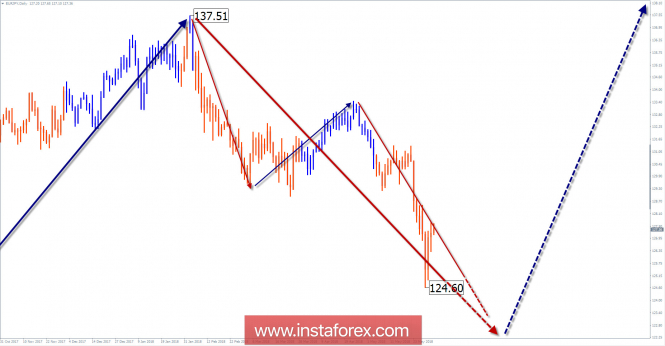
Wave picture of the chart D1:
The dominant direction of the price on the cross chart since June 2016 is set by an upward wave. The wave level of the entire motion approaches the W1 chart. The structure of the wave is not complete. Its last descending section took the place of correction.
The wave pattern of the graph H1:
The last bearish wave counting from April 24 has reached the upper limit of the calculated completion zone, but no reversal signals on the chart have been observed so far.
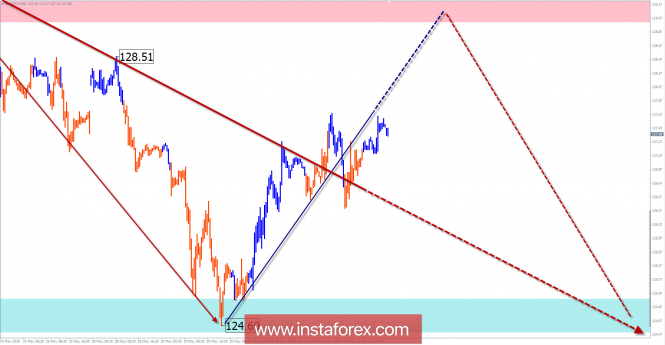
The wave pattern of the M15 chart:
Towards the main direction of the price move from May 29 formed a bullish movement. The wave does not have a reversal potential and it will most likely take the place of an intermediate rollback.
Recommended trading strategy:
Trading on the N1 chart and above after the completion of the entire bearish correction, you need to wait for the signals to buy. Preferring to trade on smaller time frame makes sense in the resistance zone to sell the pair.
Resistance zones:
- 129.00 / 129.50
Support zones:
- 125.00 / 124.50
Explanations to the figures:
A simplified wave analysis uses a simple waveform, in the form of a 3-part zigzag (ABC). The last incomplete wave for every time frame is analyzed. Zones show the calculated areas with the greatest probability of a turn.
Arrows indicate the counting of wave according to the technique used by the author. The solid background shows the generated structure and the dotted exhibits the expected wave motion.
Attention: The wave algorithm does not take into account the duration of the tool movements in time. To conduct a trade transaction, you need to confirm the signals used by your trading systems.
The material has been provided by InstaForex Company - www.instaforex.com