
Technical outlook:
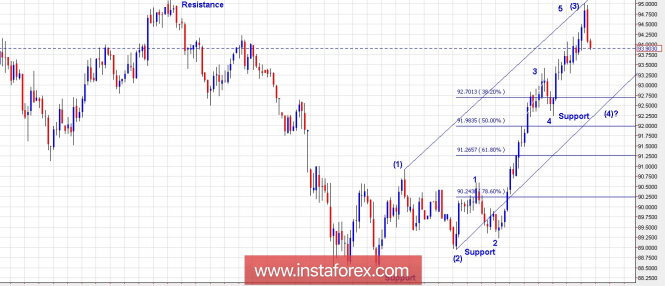
The US Dollar Index has finally formed an engulfing bearish candlestick pattern yesterday as seen on the daily chart presented here. The index is following through well even today and should continue dropping towards 92.50/70 levels going forward. Please note that the index remained just shy of breaking above 95.00 resistance levels before pulling back sharply yesterday. It looks that the index is all set to retrace lower towards 92.50/70 levels before resuming its rally towards 98.00 levels. Looking into the wave counts, the index has completed waves (1) through (3) and is now already on to its way towards wave (4) lower. Also note that fibonacci 0.382 support is also seen through the same price as 92.50.70 according to the channel line support shown here. If this count holds to be true, we shall expect the index to drop lower into wave (4) near the channel support before resuming higher again.
Trading plan:
Aggressive traders please remain short with stop above 95.00 levels, target 92.50/70.
Fundamental outlook:
Watch out for EUR zone consumer price index at 05:00 AM EST followed by Canada's GDP and US PCE Core at 08:30 AM EST.
Good luck!
The material has been provided by InstaForex Company - www.instaforex.com