
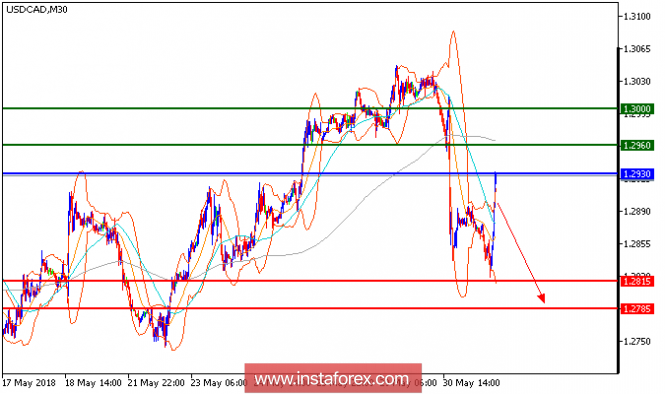
Technical Outlook :Our all downside target which we predicted in yesterday's analysis have been hit. The pair remains on the downside, capped by its falling 50-period moving average. Furthermore, the relative strength index is bearish below its neutrality area at 50, without showing any reversal signal. Last but not least, the key resistance at 1.2930 maintains the strong selling pressure on the prices. To conclude, as long as 1.2930 is not surpassed, look for a return to 1.2815 and 1.2785 in extension.
Fundamentals:
Canada's economy expanded at a slower pace than expected in the first quarter, as housing investment dropped sharply. Weaker consumer spending and lower exports of non energy products also weighed on growth.
Canada's gross domestic product, or the broadest measure of goods and services produced in an economy, rose at a 1.3% annualized rate in the first quarter of 2018, to 1.877 trillion Canadian dollars ($1.455 trillion). The gain matched an earlier forecast by the Bank of Canada, but fell short of market expectations for a 1.9% advance, according to economists at Royal Bank of Canada.
Chart Explanation: The black line shows the pivot point. Currently, the price is above the pivot point which is a signal for long positions. If it remains below the pivot point, it will indicate short positions. The red lines show the support levels, while the green line indicates the resistance levels. These levels can be used to enter and exit trades.
Resistance levels: 1.2930, 1.2960, and 1.3000
Support levels: 1.2815, 1.2785, and 1.2740
The material has been provided by InstaForex Company - www.instaforex.com