
The USD/JPY pair made a new higher high yesterday but the Daily RSI does not confirm it. This is a first sign of a bearish divergence in the Daily chart. Price remains in a bullish uptrend, but any break below 109.40 will confirm a trend change to bearish.
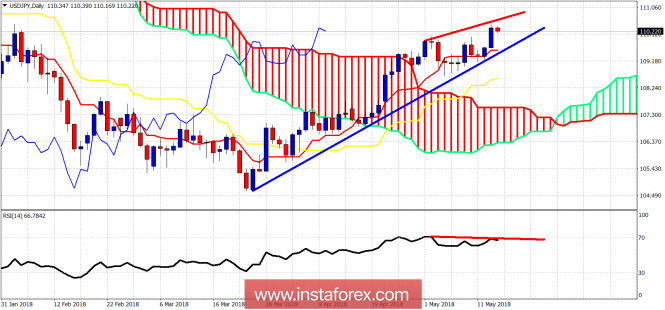
Red lines - bearish divergence
Blue line - support trend line
The USD/JPY pair continues to make higher highs and higher lows. Daily support is found at 109.55-109.40. So any pull back that holds above this area is considered a buying opportunity for a move towards 111. The bearish divergence provides us a warning but not a reversal signal. This signal will come with the break below 109.40. If and when this support fails to hold, we should expect USD/JPY to fall at least towards the Daily cloud support currently at 107.40.
The material has been provided by InstaForex Company - www.instaforex.com