
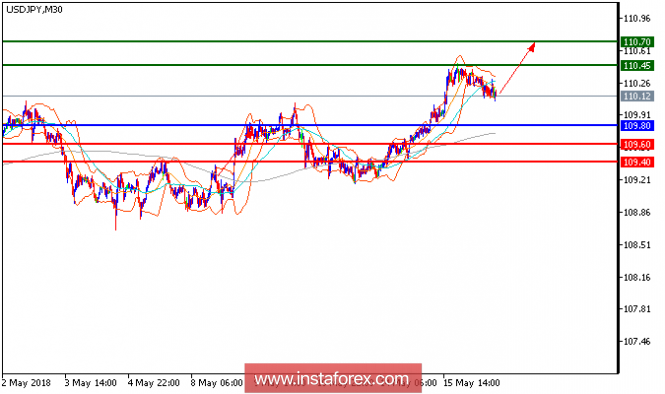
All our upside targets which we predicted in our previous analysis have been hit. The pair keeps trading on the upside targeting the overhead resistance at 110.45 (around the high of yesterday, May 15). Intraday bullishness is maintained by those well-directed technical indicators, including the 20-period, 50-period moving averages and the relative strength index. Upon crossing 110.45, the next upside target at 110.70 would come into sight. The trailing key support has been raised to the psychologically significant level of 109.80, losing which would call for a further decline toward 109.60.
Chart Explanation: The black line shows the pivot point. The present price above the pivot point indicates a bullish position, and the price below the pivot point indicates a short position. The red lines show the support levels, and the green line indicates the resistance levels. These levels can be used to enter and exit trades.
Strategy: BUY, stop loss at 109.80, take profit at 110.45.
Resistance levels: 110.45, 110.70, and 111.00
Support levels: 109.60, 109.40, and 109.00.
The material has been provided by InstaForex Company - www.instaforex.com