
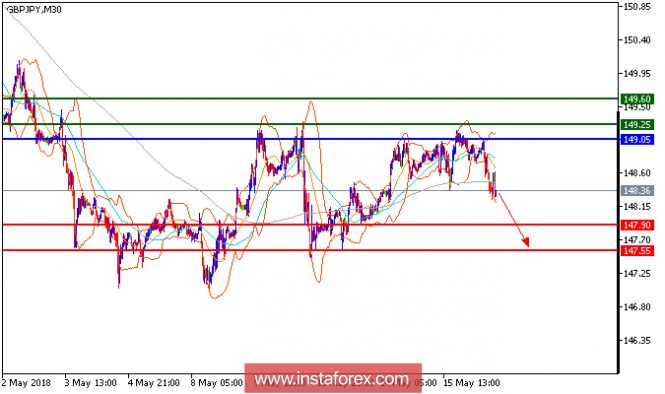
GBP/JPY is under pressure and expected to trade in a lower range. Although the pair posted a rebound from 147.55, it is still capped by a declining 50-day moving average. The relative strength index is mixed to bearish. The key resistance level at 149.05 should maintain the selling pressure. Hence, as long as this key level is not surpassed, look for a return with targets at 147.90 and 147.55 in extension.
Chart Explanation: The black line shows the pivot point. Currently, the price is above the pivot point which is a signal for long positions. If it remains below the pivot point, it will indicate short positions. The red lines show the support levels, while the green line indicates the resistance levels. These levels can be used to enter and exit trades.
Resistance levels: 149.25,149.60, and 150.05
Support levels: 147.90, 147.55, and 147.00
The material has been provided by InstaForex Company - www.instaforex.com