
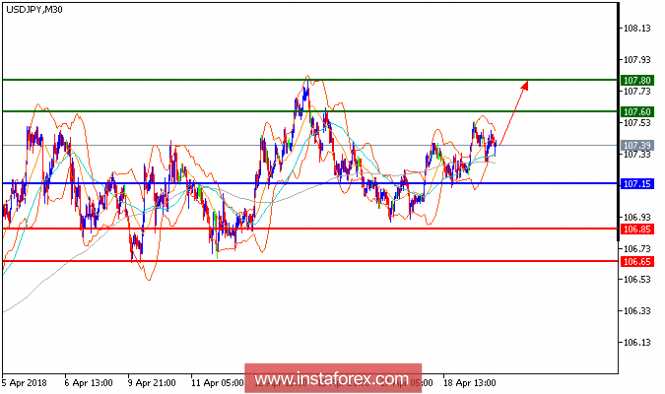
Our first target which we predicted in the previous analysis has been hit. USD/JPY is expected to trade in higher range. The pair is posting a new upleg while striking against the upper Bollinger band. Strong upward momentum is evidenced by the relative strength index, which is well directed in the 60s. It is on track to revisit 107.40 (around the high of yesterday, April 18). Above that level, it could target 107.60 on the upside. Key support is located at 107.05.
Chart Explanation: The black line shows the pivot point. The present price above the pivot point indicates a bullish position, and the price below the pivot point indicates a short position. The red lines show the support levels, and the green line indicates the resistance levels. These levels can be used to enter and exit trades.
Strategy: BUY, stop loss at 107.15, take profit at 107.60.
Resistance levels: 107.60, 107.80, and 108.15
Support levels: 106.85, 106.65, and 106.35.
The material has been provided by InstaForex Company - www.instaforex.com