
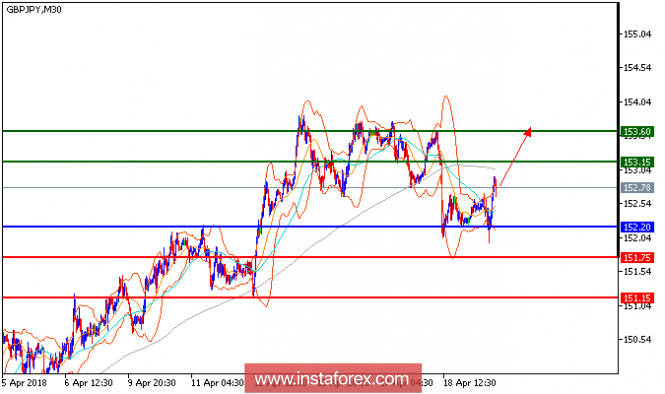
GBP/JPY is expected to trade with a bullish outlook. The pair broke above its upper boundary of Bollinger Bands, indicating the potential of upward acceleration. The rising 50-period moving average maintains the bullish bias. The relative strength index is heading upward, calling for a new upleg. To sum up, above 152.20, look a further advance with targets at 153.15 and 153.60 in extension.
Chart Explanation: The black line shows the pivot point. Currently, the price is above the pivot point which is a signal for long positions. If it remains below the pivot point, it will indicate short positions. The red lines show the support levels, while the green line indicates the resistance levels. These levels can be used to enter and exit trades.
Resistance levels: 153.15, 153.60, and 154.15
Support levels: 151.75, 151.15, and 150.80.
The material has been provided by InstaForex Company - www.instaforex.com