
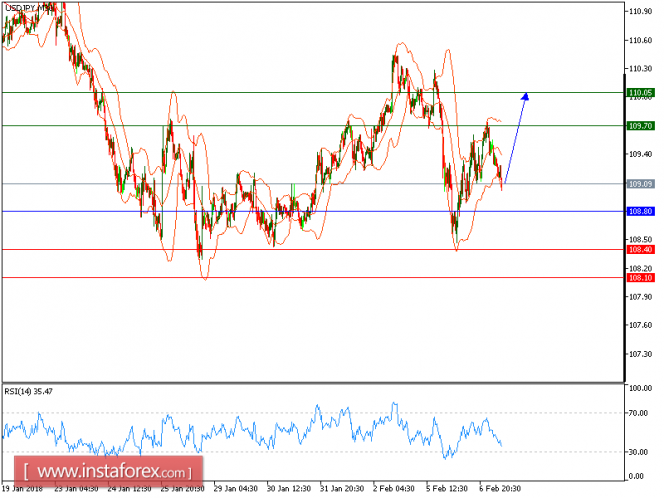
Our first target which we predicted in yesterday's analysis has been hit. The pair continues a rebound initiated at a low of 108.43 seen yesterday (February 6). Currently support is located at 108.80 while striking against the upper Bollinger band. Extra support is provided by the ascending 20-period moving average, which has crossed above the 50-period one. The relative strength index is still going strong, indicating continued upward momentum for the pair. As intraday bullishness persists, the pair should proceed toward the overhead resistance at 109.70 before advancing toward 110.05.
Alternatively, if the price moves in the opposite direction, a Short position is recommended to be below 108.80 with a target of 109.70.
Chart Explanation: The black line shows the pivot point. The current price above the pivot point indicates a bullish position, while the price below the pivot point is a signal for a short position. The red lines show the support levels, and the green line indicates the resistance level. These levels can be used to enter and exit trades.
Strategy: BUY, stop loss at 108.80, take profit at 109.75.
Resistance levels: 109.70, 110.75, and 111.00
Support levels: 108.40, 108.10, and 107.75.
The material has been provided by InstaForex Company - www.instaforex.com