MG Network

something big isHappening!

In the mean time you can connect with us with via:

Copyright © Money Grows Network | Theme By Gooyaabi Templates

Money Grows Network

Archive

Powered by Blogger.

Welcome To Money Grows Network

Verified By

2006 - 2019 © www.moneygrows.net

Investments in financial products are subject to market risk. Some financial products, such as currency exchange, are highly speculative and any investment should only be done with risk capital. Prices rise and fall and past performance is no assurance of future performance. This website is an information site only.

Popular

Pages

Expert In

Name*


Message*

Ichimoku cloud indicator analysis of gold for February 7, 2018

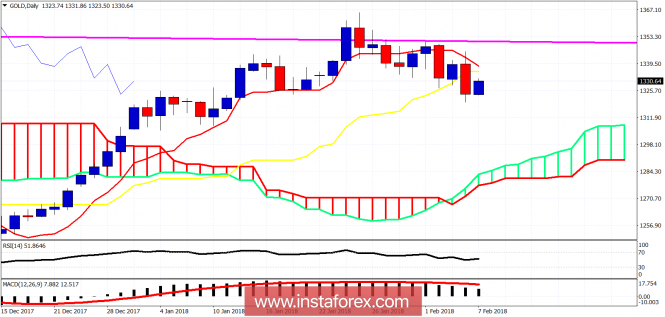
Gold price broke below the $1,334-30 support and pushed towards $1,319-23 where the Head and shoulders neckline support is found. The price briefly broke the neckline but reversed back upwards towards $1,331. As long as price is below $1,345 I believe it is more probable to see $1,310.

analytics5a7aaedc979f1.png

Blue line - neckline support

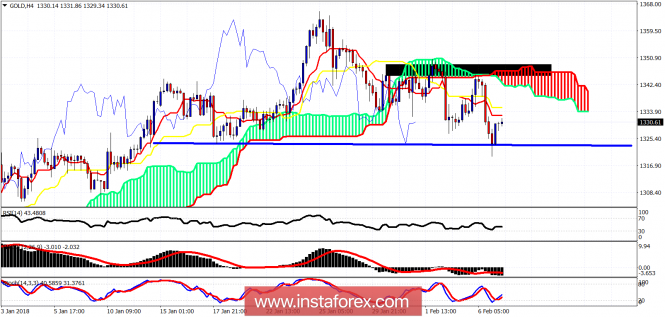
Black rectangle - resistance

Gold price is trading below both the tenkan- and kijun-sen 4 hour indicators. Trend is bearish. Resistance is at $1,333-35 and next at $1,345-48. As long as the price is below the 2nd resistance, trend will remain bearish and I will be expecting prices to move towards $1,310-$1,300.

analytics5a7aaf3b6f9c8.png

On a daily basis, Gold price is trading below both the tenkan- and kijun-sen indicators. Trend is showing reversal signs. Daily resistance is at $1,340. A daily close above $1,340 will put bears on a difficult spot. A break of yesterday lows will be a bearish sign and would push price towards a cloud support. A break above $1,348-50 will open the way for a move towards $1,380-$1,400.The material has been provided by InstaForex Company - www.instaforex.com