
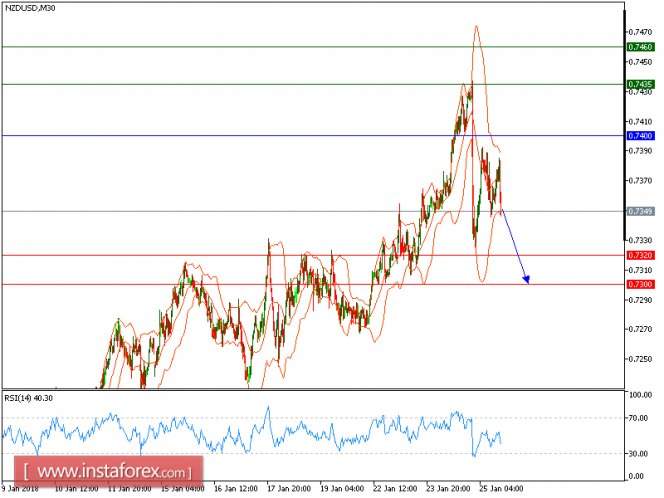
Our upside targets which we predicted in yesterday's analysis have been hit. NZD/USD is turning down now. The pair collapsed last night, and broke below its 50-period moving average support. The 20-period moving average is also turning down, calling for a new pullback. Besides, the relative strength index is mixed to bearish.
In which case, as long as 0.7400 is not surpassed, likely decline to 0.7320 and 0.7300 in extension.
The black line shows the pivot point. Currently, the price is above the pivot point, which is a signal for long positions. If it remains below the pivot point, it will indicate short positions. The red lines are showing the support levels, while the green line is indicating the resistance levels. These levels can be used to enter and exit trades.
Resistance levels: 0.7435, 0.7460, and 0.7485.
Support levels: 0.7320, 0.7300, and 0.7265.
The material has been provided by InstaForex Company - www.instaforex.com