
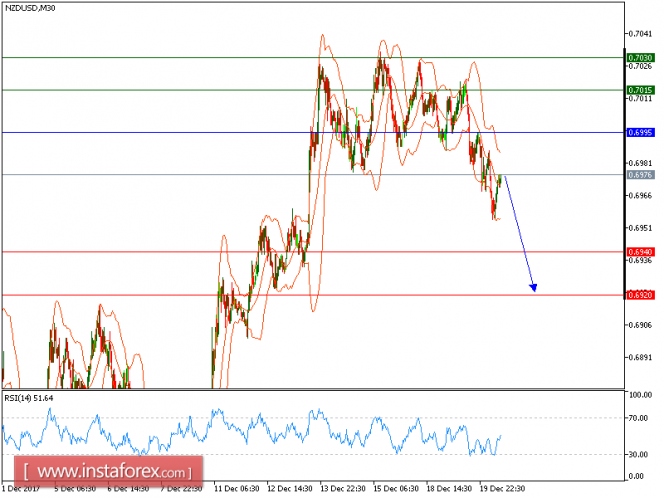
All our targets which were predicted in yesterday's analysis have been hit. The pair is still expected to trade in a lower range. The pair is trading below its declining 20-period and 50-period moving averages, which play resistance roles and maintain the downside bias. The relative strength index is bearish and calls for further downside.
Therefore, as long as 0.6995 holds on the upside, look for a further drop with targets at 0.6940 and 0.6920 in extension.
The black line shows the pivot point. Currently, the price is above the pivot point, which is a signal for long positions. If it remains below the pivot point, it will indicate short positions. The red lines are showing the support levels and the green line is indicating the resistance levels. These levels can be used to enter and exit trades.
Resistance levels: 0.7015, 0.7030, and 0.7060
Support levels: 0.6940, 0.6920, and 0.6875
The material has been provided by InstaForex Company - www.instaforex.com