
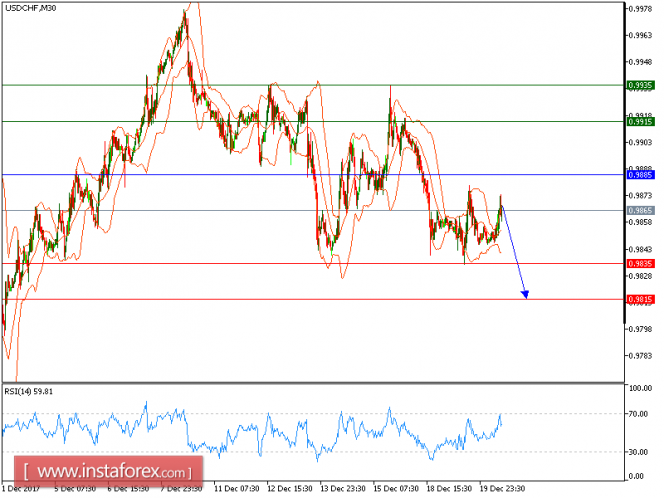
We will retain our yesterday's outlook of the pair. The pair retreated from the key resistance at 0.9885 and broke below its 20-period and 50-period moving averages. The relative strength index is below its neutrality level at 50.
Therefore, as long as 0.9885 holds on the upside, look for a return to 0.9835. A break below of this level would trigger a new decline to 0.9815.
Chart Explanation: The black line shows the pivot point. The present price above the pivot point indicates a bullish position, and the price below the pivot points indicates a short position. The red lines show the support levels and the green line indicates the resistance levels. These levels can be used to enter and exit trades.
Strategy: SELL, Stop Loss: 0.9885, Take Profit: 0.9835
Resistance levels: 0.9905, 0.9935, and 0.9975
Support levels: 0.9835, 0.9815, and 0.9795
The material has been provided by InstaForex Company - www.instaforex.com