
There was a false breakout yesterday in the USD/CAD pair. Price broke above 1.2910 but sharply reversed back below 1.2870. This is not a bullish sign. At least for the short term.
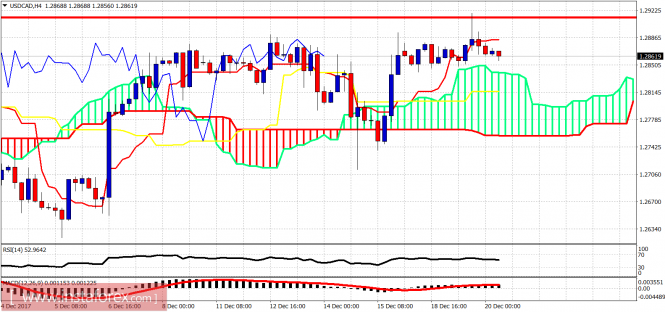
Red line - long-term resistance
The USD/CAD pair is trading above the 4-hour Kumo (cloud). Trend is bullish as long as price is above 1.2840. Price made a reversal pattern with a false breakout yesterday. This is a bearish sign. Support is at 1.2840-1.2780. As long as price is above this area, bulls still hope for a clear break above 1.29. Resistance at 1.29 is very important because if it is broken, the target will be around 1.31-1.32.
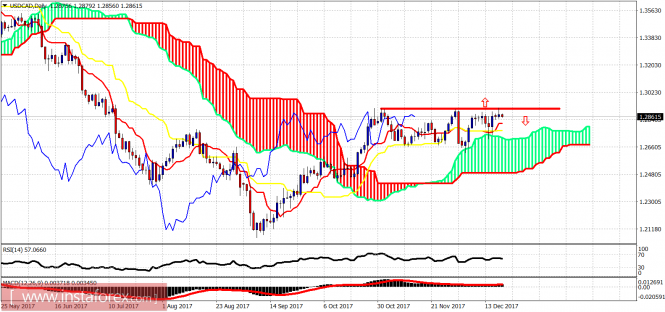
Red line - long-term resistance
On a daily basis, price is above the Kumo (cloud) support. Price has hit the resistance trend line at the 1.29 area 3 times so far. A break above it will be a very bullish signal that would push price towards 1.31-1.32. Critical support is at 1.2730. Break below it and we could be starting a big decline towards 1.20.
The material has been provided by InstaForex Company - www.instaforex.com