
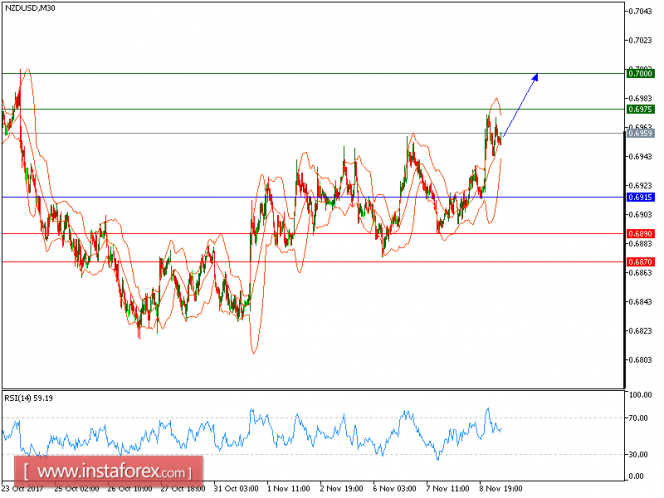
NZD/USD is expected to trade with a bullish bias above 0.6915. The pair is holding on the upside. The rising 20-period and 50-period moving averages maintain the bullish bias. The relative strength index is bullish, calling for another rise. The downside potential should be limited by the key support at 0.6915.
Hence, as long as this key level is not broken, look for a further advance with targets at 0.6975 and 0.7000 in extension.
The black line shows the pivot point. Currently, the price is above the pivot point, which indicates long positions. If it remains below the pivot point, it will indicate short positions. The red lines are showing the support levels and the green line is indicating the resistance levels. These levels can be used to enter and exit trades.
Resistance levels: 0.6975, 0.7000, and 0.7045
Support levels: 0.6890, 0.687, and 0.6835
The material has been provided by InstaForex Company - www.instaforex.com