
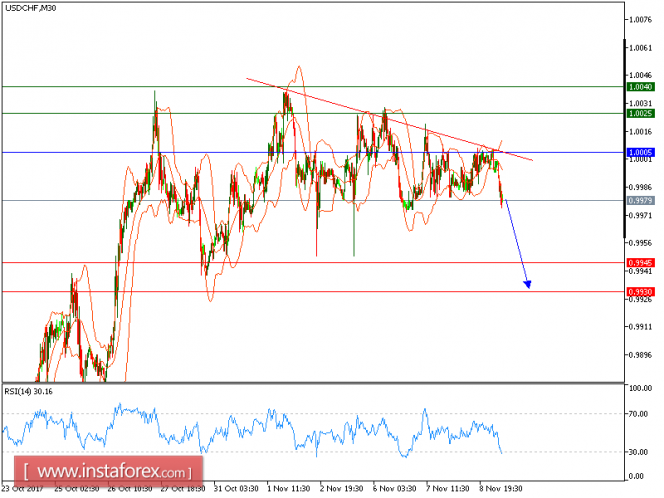
USD/CHF is under pressure and expected to continue its downside movement. The pair is trading below its key resistance level at 1.0005, which should maintain the selling pressure. The relative strength index lacks upward momentum.
Therefore, as long as 1.0005 is not surpassed, look for a return to 0.9945. A break below this level would trigger a new decline to 0.9930.
Chart Explanation: The black line shows the pivot point. The present price above the pivot point indicates a bullish position, and the price below the pivot points indicates a short position. The red lines show the support levels and the green line indicates the resistance levels. These levels can be used to enter and exit trades.
Strategy: SELL, Stop Loss: 1.0005, Take Profit: 0.9945
Resistance levels: 1.0025, 1.0040, and 1.0075
Support levels: 0.9945, 0.9930, and 0.9900
The material has been provided by InstaForex Company - www.instaforex.com