MG Network

something big isHappening!

In the mean time you can connect with us with via:

Copyright © Money Grows Network | Theme By Gooyaabi Templates

Money Grows Network

Archive

Powered by Blogger.

Welcome To Money Grows Network

Verified By

2006 - 2019 © www.moneygrows.net

Investments in financial products are subject to market risk. Some financial products, such as currency exchange, are highly speculative and any investment should only be done with risk capital. Prices rise and fall and past performance is no assurance of future performance. This website is an information site only.

Popular

Pages

Expert In

Name*


Message*

Technical analysis of gold for November 9, 2017

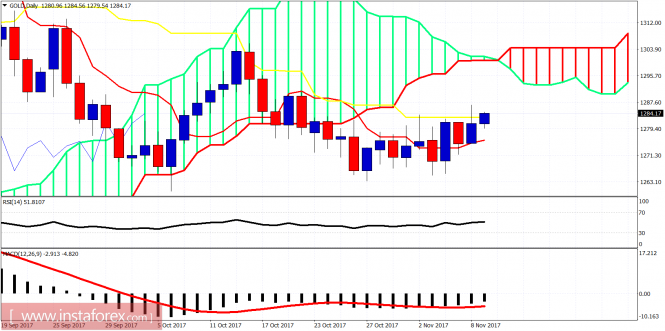
Gold price has been making higher highs and higher lows since a pullback from the low at $1,263. The short-term trend has changed to bullish and is challenging important resistance at $1,283-86. Gold is in a bullish short-term trend as long as price is above $1,272.

analytics5a040878b9880.png

Blue lines - bullish channel

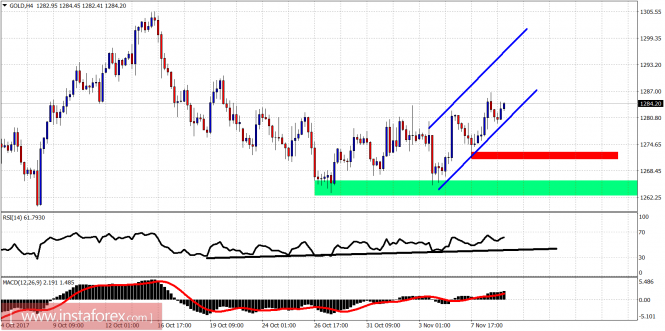
Red rectangle - short-term support

Green rectangle - important medium-term support

Gold price is trading inside a bullish channel. The trend is bullish. Support is at $1,272. Breaking below the red rectangle will increase the chances of breaking below the green rectangle support at $1,262. Breaking below $1,262 will open the way for a push towards $1,245.

analytics5a0408c3c4561.png

For now, gold price is trading above the daily kijun-sen (yellow line indicator) resistance. A daily close above it will open the way for a push higher towards the Kumo (cloud) resistance at $1,300. A rejection here will increase the chances we are still in a corrective phase and will eventually move towards $1,245-50. I remain longer-term bullish gold.The material has been provided by InstaForex Company - www.instaforex.com