
Technical outlook:
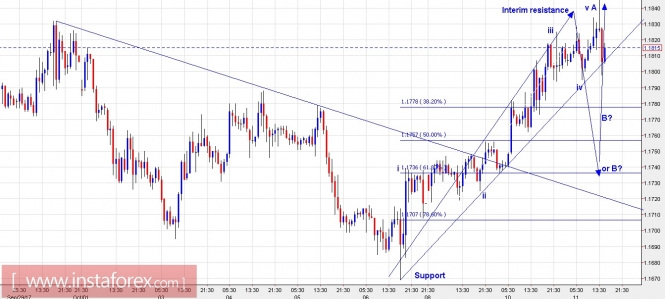
The EUR/USD pair looks to have terminated its first leg labelled as A, within its 3 waves A-B-C corrective rally towards 1.1900/30 levels going forward. A short-term chart view presented here already suggests that the pair should be now looking to drop lower terminating into wave B around 1.1730 levels before turning bullish again. Please note that an interim resistance is just in place at 1.1844 levels and that the pair is poised to break below its counter trend line support as well. Furthermore, note that the previous trend line resistance turned support trend line is now passing near the fibonacci 0.618 support levels of the entire rally between 1.1670 through 1.1844 levels respectively. A simple trading strategy that could be deployed from this point is to sell on rallies.Expecting a quick snap drop towards 1.1720 levels before the larger counter trend rally resumes.
Trading plan:
Please remain short now, look to add more towards 1.1920/30 levels, stop above 1.2092, target 1.1500.This is a long-term strategy; we shall update short-term strategies tomorrow.
US Dollar Index chart setups:
Technical outlook:
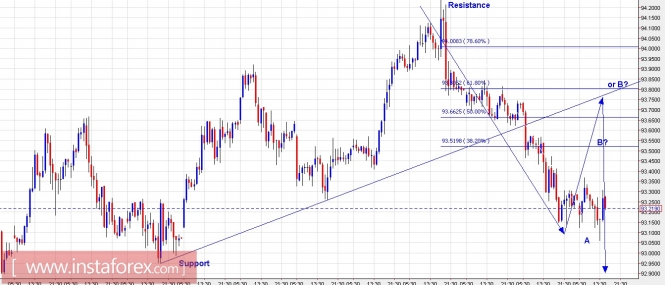
The US Dollar Index has dropped lower pretty close to its support around 93.00 levels as depicted on the short-term chart setup here. The index seems to have terminated its first corrective drop into wave A as labelled here. The most probable wave count should be higher towards wave B, which is also converging with the back side of support turned resistance trend line and the fibonacci 0.618 resistance of the entire drop between 94.30 through 93.00 levels respectively. Please note that resistance is strong at 94.30 levels, while immediate support is seen through 93.00 levels respectively. A long-term trading strategy has been displayed below and one should follow the short-term trading strategies along the larger trend from tomorrow. Buying on dips seem to be a simple trading strategy here.
Trading plan:
Please remain long now, add more towards 92.50/60 levels, stop below 91.00, target 95.00 and higher.
Fundamental outlook:
Please watch out for FOMC meeting minutes (Sep 20), at 02:00 PM EST today.
Good luck!
The material has been provided by InstaForex Company - www.instaforex.com