
Technical outlook:
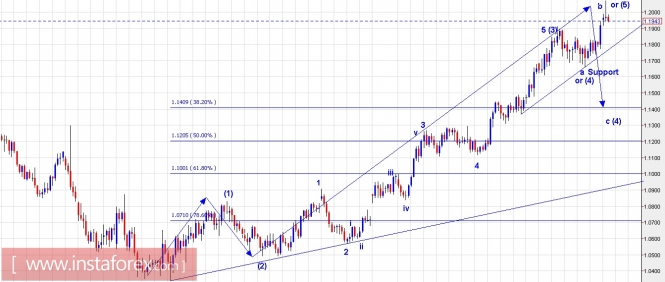
We are approaching the end of August 2017 and as done in the early part of the month, a daily chart view has been presented with a larger picture in view for a broader trading plan for September 2017. As seen here, EUR/USD has formed a topping candlestick pattern called as a "Pinbar" yesterday, before reversing lower. It is trading more than 120 pips lower at 1.1945 levels for now and should be looking to push further lower going forward. The overall wave count from January 2017 suggests that EUR/USD has at least completed waves (1), (2) and (3), and is producing wave (4) as an expanded flat. As an alternate count, the pair might have completed five waves already and is going to produce a meaningful retracement lower. In both the probabilities mentioned here, the common point is a drop towards 1.1400/50 levels at least. A break below the immediate support trend line and subsequently below 1.1650 levels would confirm.
Trading plan:
Still, it is strongly recommended to remain short with a stop around 1.2100 levels targeting 1.1500 and lower.
GBP/USD chart setups:
Technical outlook:
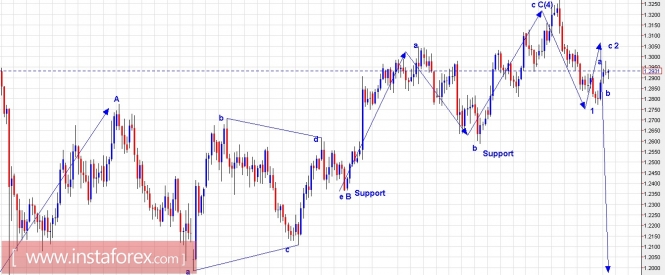
As done in the beginning of this month, we are again presenting a larger picture of GBP/USD on the daily chart depicted here. The wave counts are clearly suggesting that the counter trend corrective rally that began in mid-2016 has completed at 1.3267 levels, labeled as A-B-C here. Please also note that wave B had unfolded as a triangle and wave C took shape of a zigzag a-b-c respectively. Furthermore, we had tracked the entire month of August 2017, that wave 1 is ready on the downside since the entire drop between 1.3267 and 1.2770 levels had unfolded as an impulse (5 waves). It is expected that GBP/USD may rally one last time through 1.3075 levels to terminate into wave 2, before dropping lower again. If this wave count presented here holds to be true, GBP/USD should be well on its wave 3 lower below 1.2000 levels in the coming weeks or months.
Trading plan:
Remain short and add more at 1.3075 levels, stop above 1.3270, target 1.2600, 1.2300 and 1.2000.
Fundamental outlook:
Watch out for German Consumer Pricing Index to be out today at 0800 AM EST, followed by the USD GDP figures both Annualized and 2Q at 0830 AM EST.
Good luck!
The material has been provided by InstaForex Company - www.instaforex.com