MG Network

something big isHappening!

In the mean time you can connect with us with via:

Copyright © Money Grows Network | Theme By Gooyaabi Templates

Money Grows Network

Archive

Powered by Blogger.

Welcome To Money Grows Network

Verified By

2006 - 2019 © www.moneygrows.net

Investments in financial products are subject to market risk. Some financial products, such as currency exchange, are highly speculative and any investment should only be done with risk capital. Prices rise and fall and past performance is no assurance of future performance. This website is an information site only.

Popular

Pages

Expert In

Name*


Message*

Ichimoku indicator analysis of gold for August 30, 2017

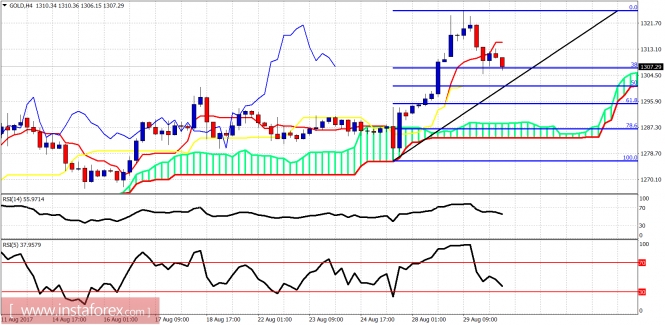
The Gold price is pulling back from our $1,320 target we were expecting. The trend remains bullish. This pullback is still considered part of an up trend. Support is at $1,308 and next at $1,295.

analytics59a6630988839.jpg

The Gold price is at the 38% Fibonacci retracement support. A break below it could push price towards the 61.8% Fibonacci retracement at $1,295. Cloud support is at $1,288.

analytics59a663388a4f0.jpg

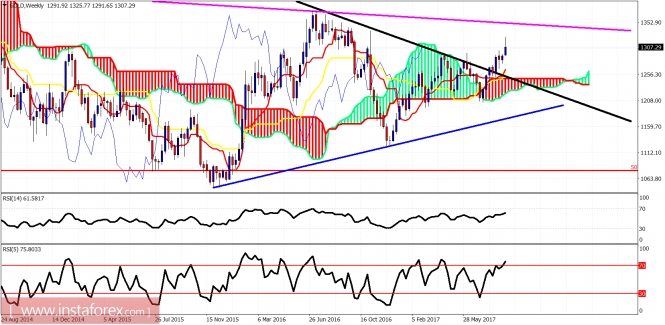
Magenta line - resistance target

Black line -long-term resistance (broken)

Blue line -long-term support

The Gold price is trading above the Kumo (cloud) in 4hour daily and weekly charts. The trend is clearly bullish. Pullbacks are considered buying opportunities. The Gold price next important target is at $1,340-50 where the magenta trend line resistance is found.

The material has been provided by InstaForex Company - www.instaforex.com