
Gold price remains in a bearish trend. Price got rejected at the resistance level of $1,230 last week and reversed and made a new lower low. We are now entering an area where Gold price could make an important long-term low.
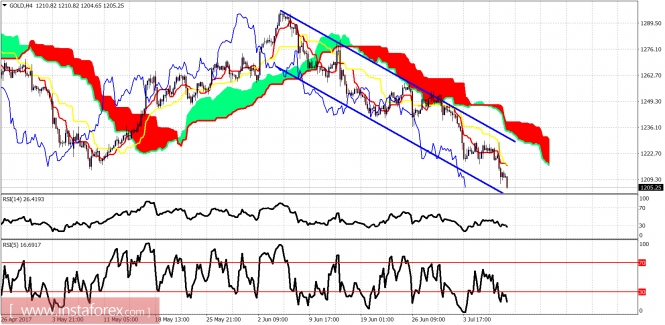
Gold price is trading inside a bearish channel and below both the tenkan- and kijun-sen indicators. Trend is clearly bearish. However there are divergence signs. Important short-term resistance is at $1,230. Support is at $1,200.
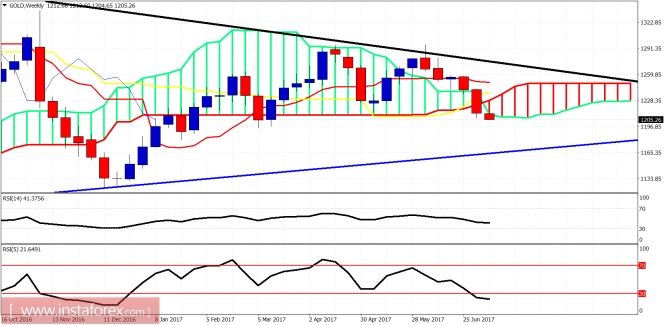
Black line - long-term resistance trend line
Blue line - long-term support trend line
Gold weekly candle has broken below the weekly Kumo. This is bearish sign. However the RSI (5) has entered oversold levels and bears should be cautious. Gold price could continue lower towards $1,170-80 but I believe we have entered a price range where we can see a long-term reversal.
The material has been provided by InstaForex Company - www.instaforex.com