
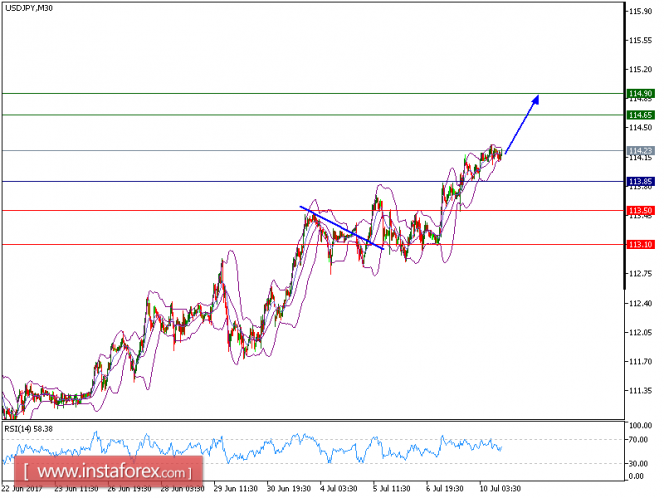
USD/JPY is expected to trade in a higher range. The pair is trading above both 20-period and 50-period moving averages, which play support roles and maintain the upside bias. The relative strength index stands firmly above its neutrality level at 50.
The U.S. Labor Department reported that non-farm payrolls increased by 222,000 in June, higher than +173,000 expected and +138,000 in May. Jobless rate rose slightly to 4.4% from 4.3% in May, while average hourly earnings gained 0.2% on month and +2.5% on year.
To sum up, as long as 113.85 is not broken, look for a further rise to 114.65 and even to 114.90 in extension.
Alternatively, if the price moves in the opposite direction as predicted, a short position is recommended above 113.85 with a target at 114.65.
Chart Explanation: The black line shows the pivot point. The current price above the pivot point indicates a bullish position while the price below the pivot point is a sign for a short position. The red lines show the support levels and the green line indicates the resistance level. These levels can be used to enter and exit trades.
Strategy : BUY , Stop Loss: 113.85, Take Profit: 114.65
Resistance levels: 114.65, 114.90, and 115.35
Support levels: 113.50,113.10, and 112.65
The material has been provided by InstaForex Company - www.instaforex.com